
Bit_Guru
42.2k Posts

Bit_Guru
 Square Verified+
Report
Block User
Only Live Trader on Binance Square 💛 // Binance, CMC & X kols handle @bitgu_ru // PnL is always Live

Live Trader

Creator Awards 2024
Open Trade
Frequent Trader
2.6 Years
63 Following
156.6K+ Followers
300.3K+ Liked
3 Badges
Posts
Portfolio
All
Quotes
Videos
Live
PINNED
·
--
Article
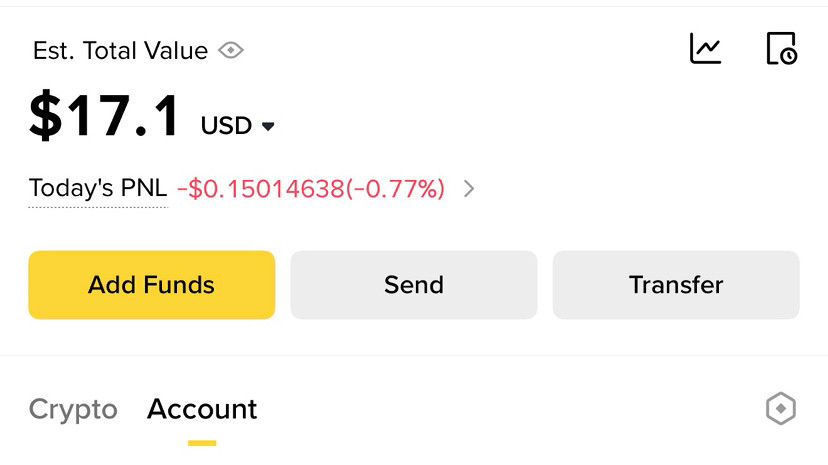
Is it possible to make $100 with only $17Many people think you need a big account to make real money in trading. That’s not true. The truth is simple it’s not about how much you start with, it’s about how you manage what you have.
Yes, it is absolutely possible to turn $17 into $100. But not by luck, not by gambling, and definitely not by chasing every pump you see. It requires discipline, patience, and a clear plan.
First, you need to understand one thing: small capital requires smart execution. You can’t afford big mistakes. One bad trade with high risk can wipe out your account. That’s why risk management becomes your strongest weapon.
Set a daily target. It doesn’t need to be huge. Even 3%–5% per day is enough. It may sound small, but consistency compounds faster than you think. If you stay disciplined, those small wins start building into something big.
Second, patience is everything. You don’t need to trade every day or every setup. Wait for clear opportunities strong support and resistance, clean breakouts, or obvious rejection zones. The market always gives chances, but only patient traders take the right ones.
Third, control your emotions. With a small account, people often overtrade because they want fast results. That’s where most fail. They increase leverage, take random entries, and ignore their plan. You have to do the opposite stay calm, follow your setup, and accept slow growth.
Another important point is consistency over hype. You don’t need one big win. You need many small correct decisions. That’s what builds your account. Even if you grow your account from $17 to $20, then $25, then $35 you are already winning.
Also, protect your capital at all costs. If you lose your account, the journey ends. If you protect it, you always have another chance.
In simple terms:
You don’t grow a small account by rushing
You grow it by repeating a disciplined process again and again
So yes, turning $17 into $100 is possible. But only for those who are willing to stay patient, follow a plan, and trade with control instead of emotion.
The market rewards consistency, not desperation
Start small
Stay focused
And let your discipline do the work
Trade Only coins Like $ETH , $BNB & $SOL
#cryptotradingpro #RiskManagementMastery
{future}(ETHUSDT)
{future}(BNBUSDT)
{future}(SOLUSDT)
Is it possible to make $100 with only $17
Many people think you need a big account to make real money in trading. That’s not true. The truth is simple it’s not about how much you start with, it’s about how you manage what you have.
Yes, it is absolutely possible to turn $17 into $100. But not by luck, not by gambling, and definitely not by chasing every pump you see. It requires discipline, patience, and a clear plan.
First, you need to understand one thing: small capital requires smart execution. You can’t afford big mistakes. One bad trade with high risk can wipe out your account. That’s why risk management becomes your strongest weapon.
Set a daily target. It doesn’t need to be huge. Even 3%–5% per day is enough. It may sound small, but consistency compounds faster than you think. If you stay disciplined, those small wins start building into something big.
Second, patience is everything. You don’t need to trade every day or every setup. Wait for clear opportunities strong support and resistance, clean breakouts, or obvious rejection zones. The market always gives chances, but only patient traders take the right ones.
Third, control your emotions. With a small account, people often overtrade because they want fast results. That’s where most fail. They increase leverage, take random entries, and ignore their plan. You have to do the opposite stay calm, follow your setup, and accept slow growth.
Another important point is consistency over hype. You don’t need one big win. You need many small correct decisions. That’s what builds your account. Even if you grow your account from $17 to $20, then $25, then $35 you are already winning.
Also, protect your capital at all costs. If you lose your account, the journey ends. If you protect it, you always have another chance.
In simple terms:
You don’t grow a small account by rushing
You grow it by repeating a disciplined process again and again
So yes, turning $17 into $100 is possible. But only for those who are willing to stay patient, follow a plan, and trade with control instead of emotion.
The market rewards consistency, not desperation
Start small
Stay focused
And let your discipline do the work
Trade Only coins Like $ETH , $BNB & $SOL
#cryptotradingpro #RiskManagementMastery
Yes, it is absolutely possible to turn $17 into $100. But not by luck, not by gambling, and definitely not by chasing every pump you see. It requires discipline, patience, and a clear plan.
First, you need to understand one thing: small capital requires smart execution. You can’t afford big mistakes. One bad trade with high risk can wipe out your account. That’s why risk management becomes your strongest weapon.
Set a daily target. It doesn’t need to be huge. Even 3%–5% per day is enough. It may sound small, but consistency compounds faster than you think. If you stay disciplined, those small wins start building into something big.
Second, patience is everything. You don’t need to trade every day or every setup. Wait for clear opportunities strong support and resistance, clean breakouts, or obvious rejection zones. The market always gives chances, but only patient traders take the right ones.
Third, control your emotions. With a small account, people often overtrade because they want fast results. That’s where most fail. They increase leverage, take random entries, and ignore their plan. You have to do the opposite stay calm, follow your setup, and accept slow growth.
Another important point is consistency over hype. You don’t need one big win. You need many small correct decisions. That’s what builds your account. Even if you grow your account from $17 to $20, then $25, then $35 you are already winning.
Also, protect your capital at all costs. If you lose your account, the journey ends. If you protect it, you always have another chance.
In simple terms:
You don’t grow a small account by rushing
You grow it by repeating a disciplined process again and again
So yes, turning $17 into $100 is possible. But only for those who are willing to stay patient, follow a plan, and trade with control instead of emotion.
The market rewards consistency, not desperation
Start small
Stay focused
And let your discipline do the work
Trade Only coins Like $ETH , $BNB & $SOL
#cryptotradingpro #RiskManagementMastery
312
55
743
689k
PINNED
·
--
Bullish
It took me 4 years in the crypto market to realize these things & you only need 2 minutes to read: 🤏
1. No matter the market condition, one thing stays the same: 8% of people will own 21 million Bitcoin.
2. Financial, capital, and risk management skills are 100 times more important than technical analysis or crypto research.
3. Earning while you sleep: There are many ways to make money in the crypto market without actively trading.
On average, #Bitcoin has increased more than 100% per year over the past 15 years. Yet, why do so few people make money? Because getting rich quickly is a common mentality. If you can't dedicate at least 4 hours a day to crypto, stick to Bitcoin and ETH—70% in BTC and 30% in ETH.
Trust no one: Trust leads to hope, disappointment, and errors. Learn independently and take responsibility for your actions. This is how to gain automatic minting experience!
The ultimate goal of investing: Make life more meaningful. If crypto investing can achieve that, do it. If not, reconsider.
Crypto is now a financial market: Originally born from technology, it's now influenced by macroeconomics and connected to mainstream financial markets.
People may discourage you from buying Bitcoin, but remember, once something is widely accepted, the opportunity might be gone. Seize your chance now!
Invest wisely, make meaningful choices, and let crypto pave the way to a better future.
#CryptoInvesting #ethbeta #Write2Earn! #BinanceTurns7 $BTC $ETH $SOL
{spot}(SOLUSDT)
{spot}(ETHUSDT)
{spot}(BTCUSDT)
It took me 4 years in the crypto market to realize these things & you only need 2 minutes to read: 🤏
1. No matter the market condition, one thing stays the same: 8% of people will own 21 million Bitcoin.
2. Financial, capital, and risk management skills are 100 times more important than technical analysis or crypto research.
3. Earning while you sleep: There are many ways to make money in the crypto market without actively trading.
On average, #Bitcoin has increased more than 100% per year over the past 15 years. Yet, why do so few people make money? Because getting rich quickly is a common mentality. If you can't dedicate at least 4 hours a day to crypto, stick to Bitcoin and ETH—70% in BTC and 30% in ETH.
Trust no one: Trust leads to hope, disappointment, and errors. Learn independently and take responsibility for your actions. This is how to gain automatic minting experience!
The ultimate goal of investing: Make life more meaningful. If crypto investing can achieve that, do it. If not, reconsider.
Crypto is now a financial market: Originally born from technology, it's now influenced by macroeconomics and connected to mainstream financial markets.
People may discourage you from buying Bitcoin, but remember, once something is widely accepted, the opportunity might be gone. Seize your chance now!
Invest wisely, make meaningful choices, and let crypto pave the way to a better future.
#CryptoInvesting #ethbeta #Write2Earn! #BinanceTurns7 $BTC $ETH $SOL
1. No matter the market condition, one thing stays the same: 8% of people will own 21 million Bitcoin.
2. Financial, capital, and risk management skills are 100 times more important than technical analysis or crypto research.
3. Earning while you sleep: There are many ways to make money in the crypto market without actively trading.
On average, #Bitcoin has increased more than 100% per year over the past 15 years. Yet, why do so few people make money? Because getting rich quickly is a common mentality. If you can't dedicate at least 4 hours a day to crypto, stick to Bitcoin and ETH—70% in BTC and 30% in ETH.
Trust no one: Trust leads to hope, disappointment, and errors. Learn independently and take responsibility for your actions. This is how to gain automatic minting experience!
The ultimate goal of investing: Make life more meaningful. If crypto investing can achieve that, do it. If not, reconsider.
Crypto is now a financial market: Originally born from technology, it's now influenced by macroeconomics and connected to mainstream financial markets.
People may discourage you from buying Bitcoin, but remember, once something is widely accepted, the opportunity might be gone. Seize your chance now!
Invest wisely, make meaningful choices, and let crypto pave the way to a better future.
#CryptoInvesting #ethbeta #Write2Earn! #BinanceTurns7 $BTC $ETH $SOL

302
102
2.2k
1.1M
·
--
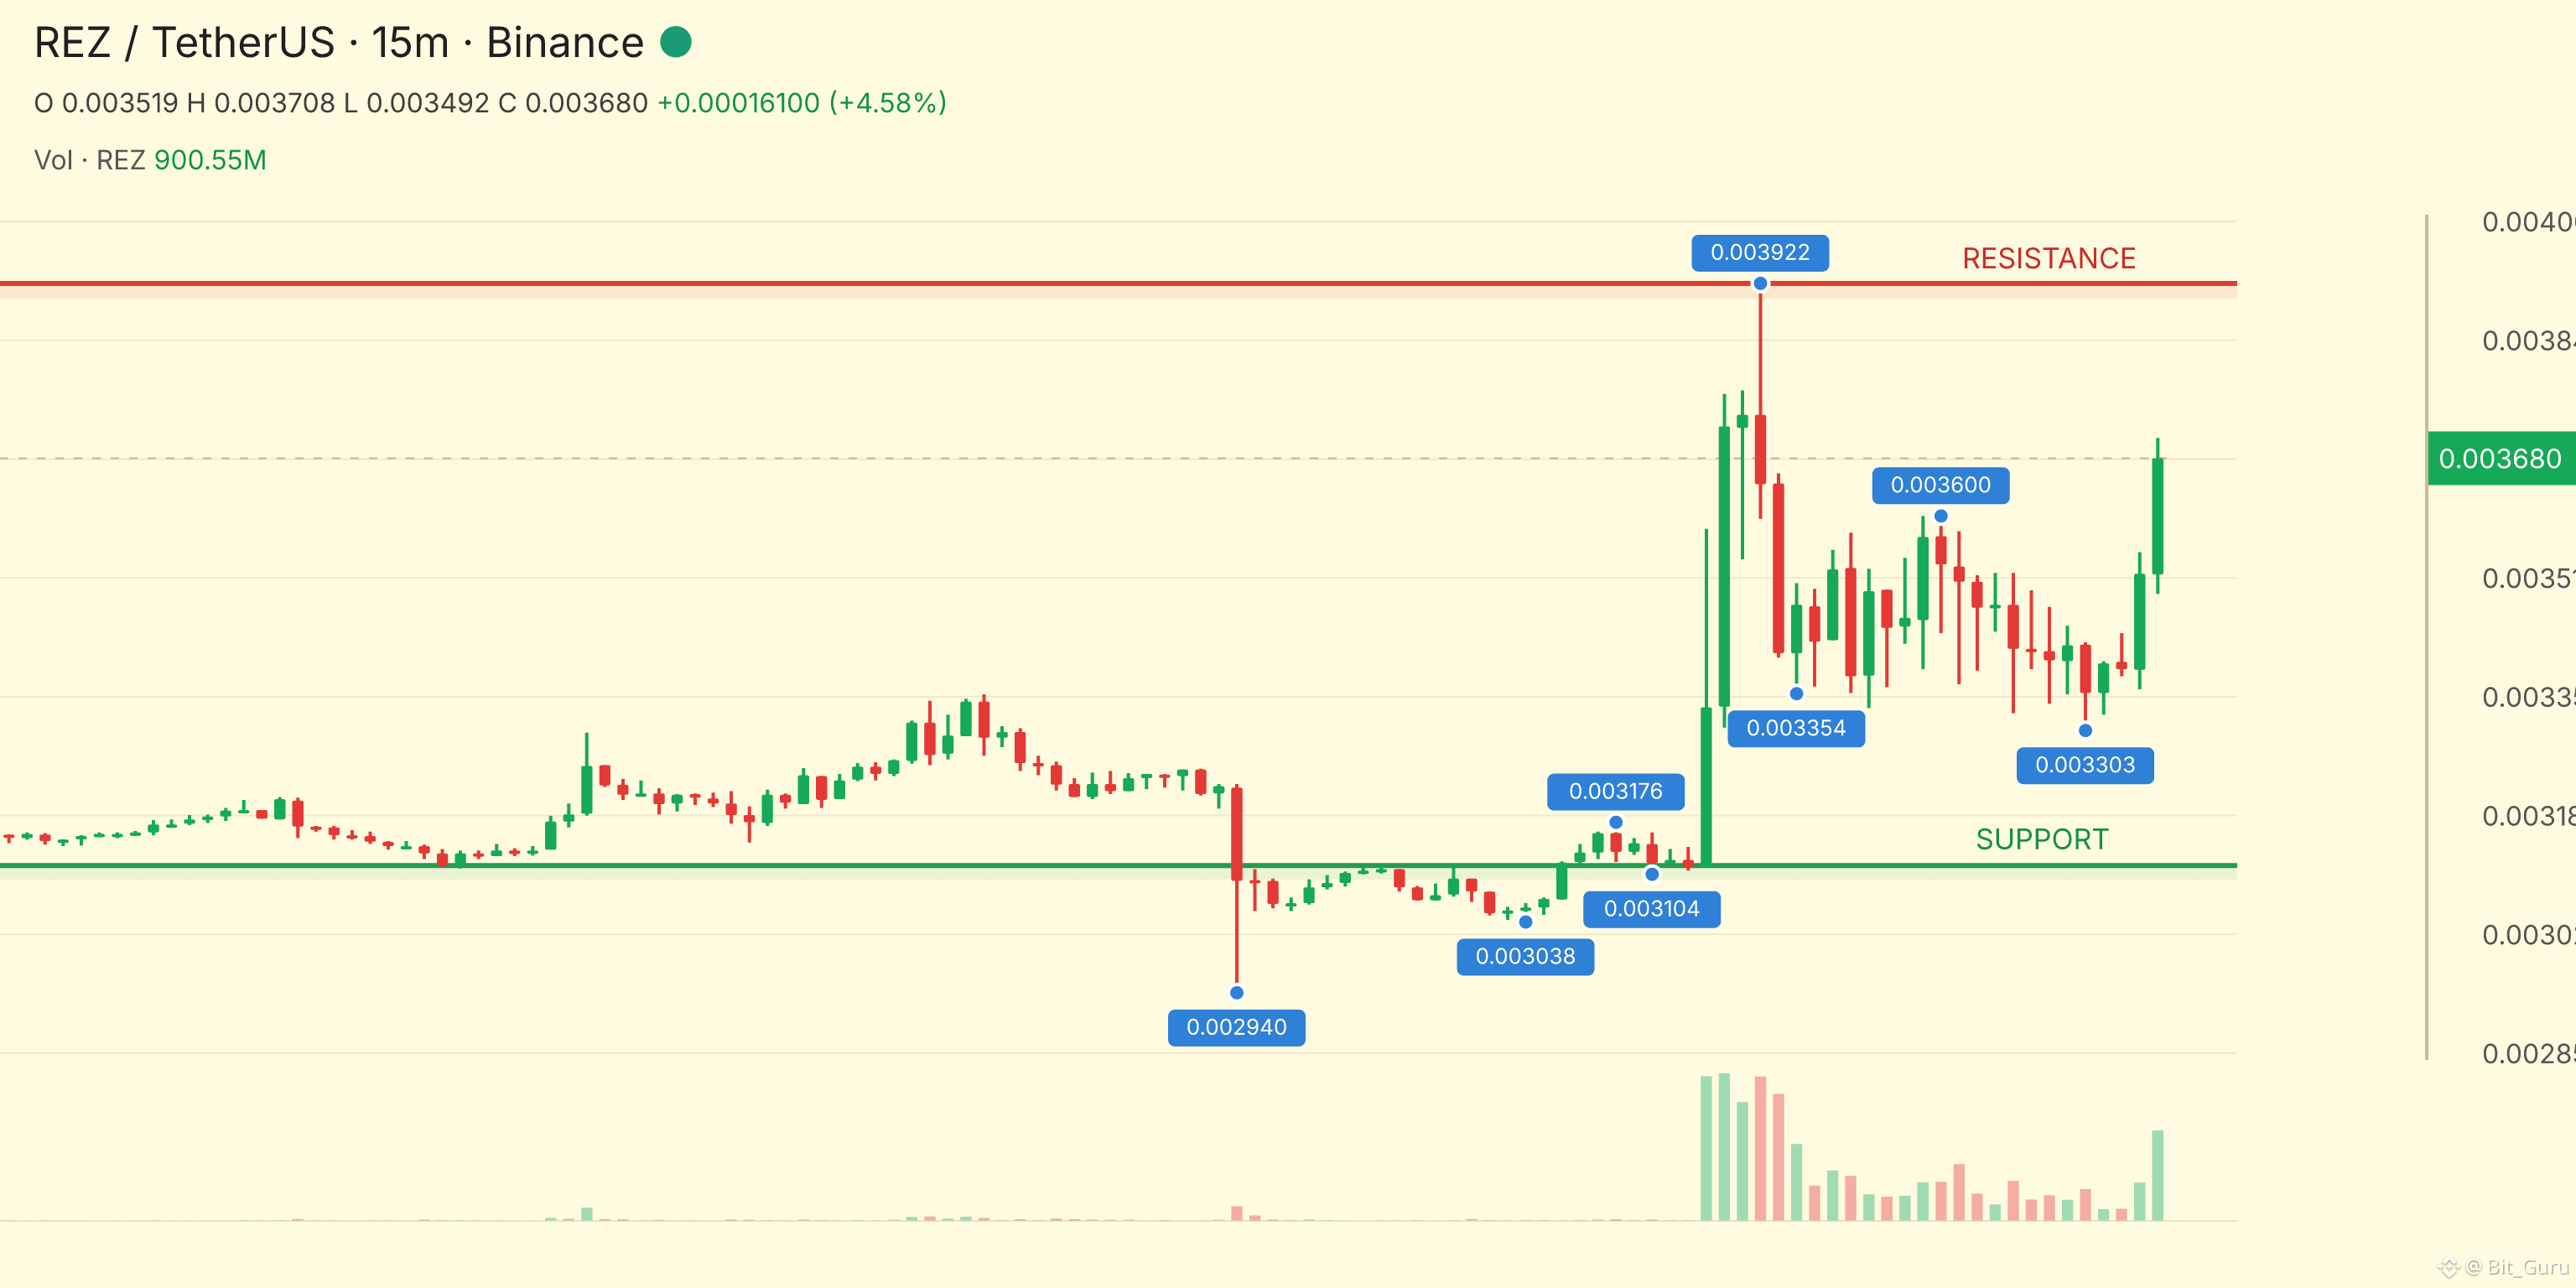
The Sellers Are Taking Control...!! $REZ is going UP...!!
ENTRY: 0.00363754 - 0.00364118
TP1: 0.00367797
TP2: 0.00369109
TP3: 0.00370420...
The Sellers Are Taking Control...!! $REZ is going UP...!!
ENTRY: 0.00363754 - 0.00364118
TP1: 0.00367797
TP2: 0.00369109
TP3: 0.00370420...
ENTRY: 0.00363754 - 0.00364118
TP1: 0.00367797
TP2: 0.00369109
TP3: 0.00370420...
103
·
--
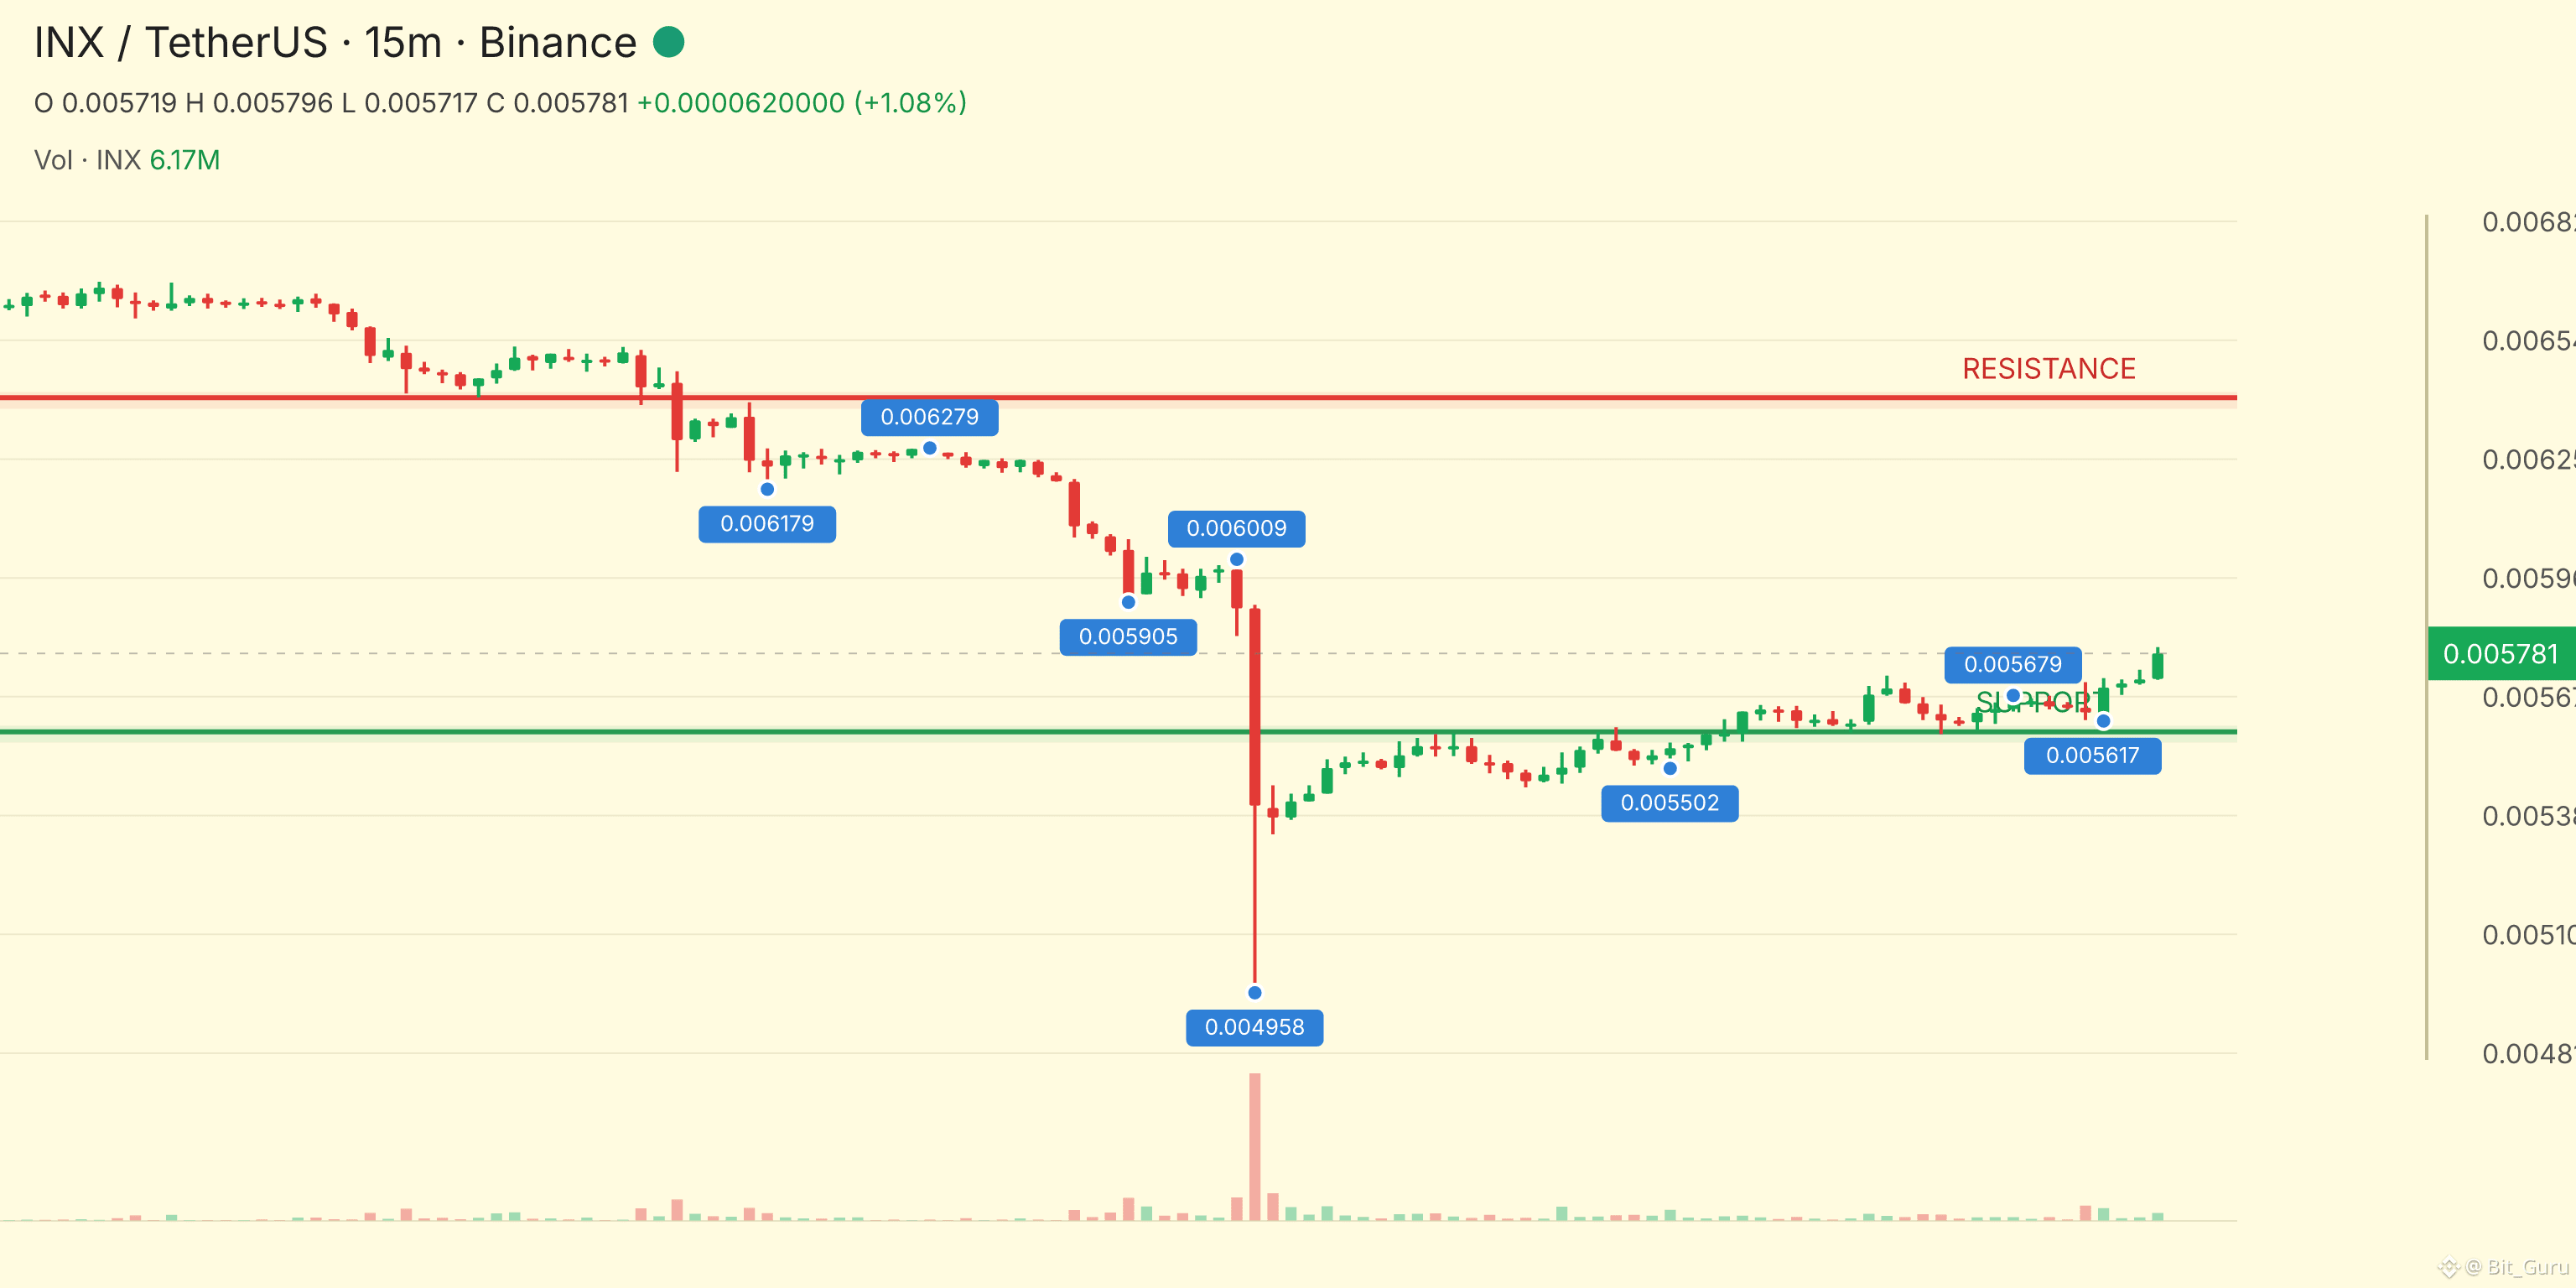
The Sellers Are Taking Control...!! $INX is going UP...!!
ENTRY: 0.00577433 - 0.00578011
TP1: 0.00583852
TP2: 0.00585934
TP3: 0.00588015...
The Sellers Are Taking Control...!! $INX is going UP...!!
ENTRY: 0.00577433 - 0.00578011
TP1: 0.00583852
TP2: 0.00585934
TP3: 0.00588015...
ENTRY: 0.00577433 - 0.00578011
TP1: 0.00583852
TP2: 0.00585934
TP3: 0.00588015...
222
·
--
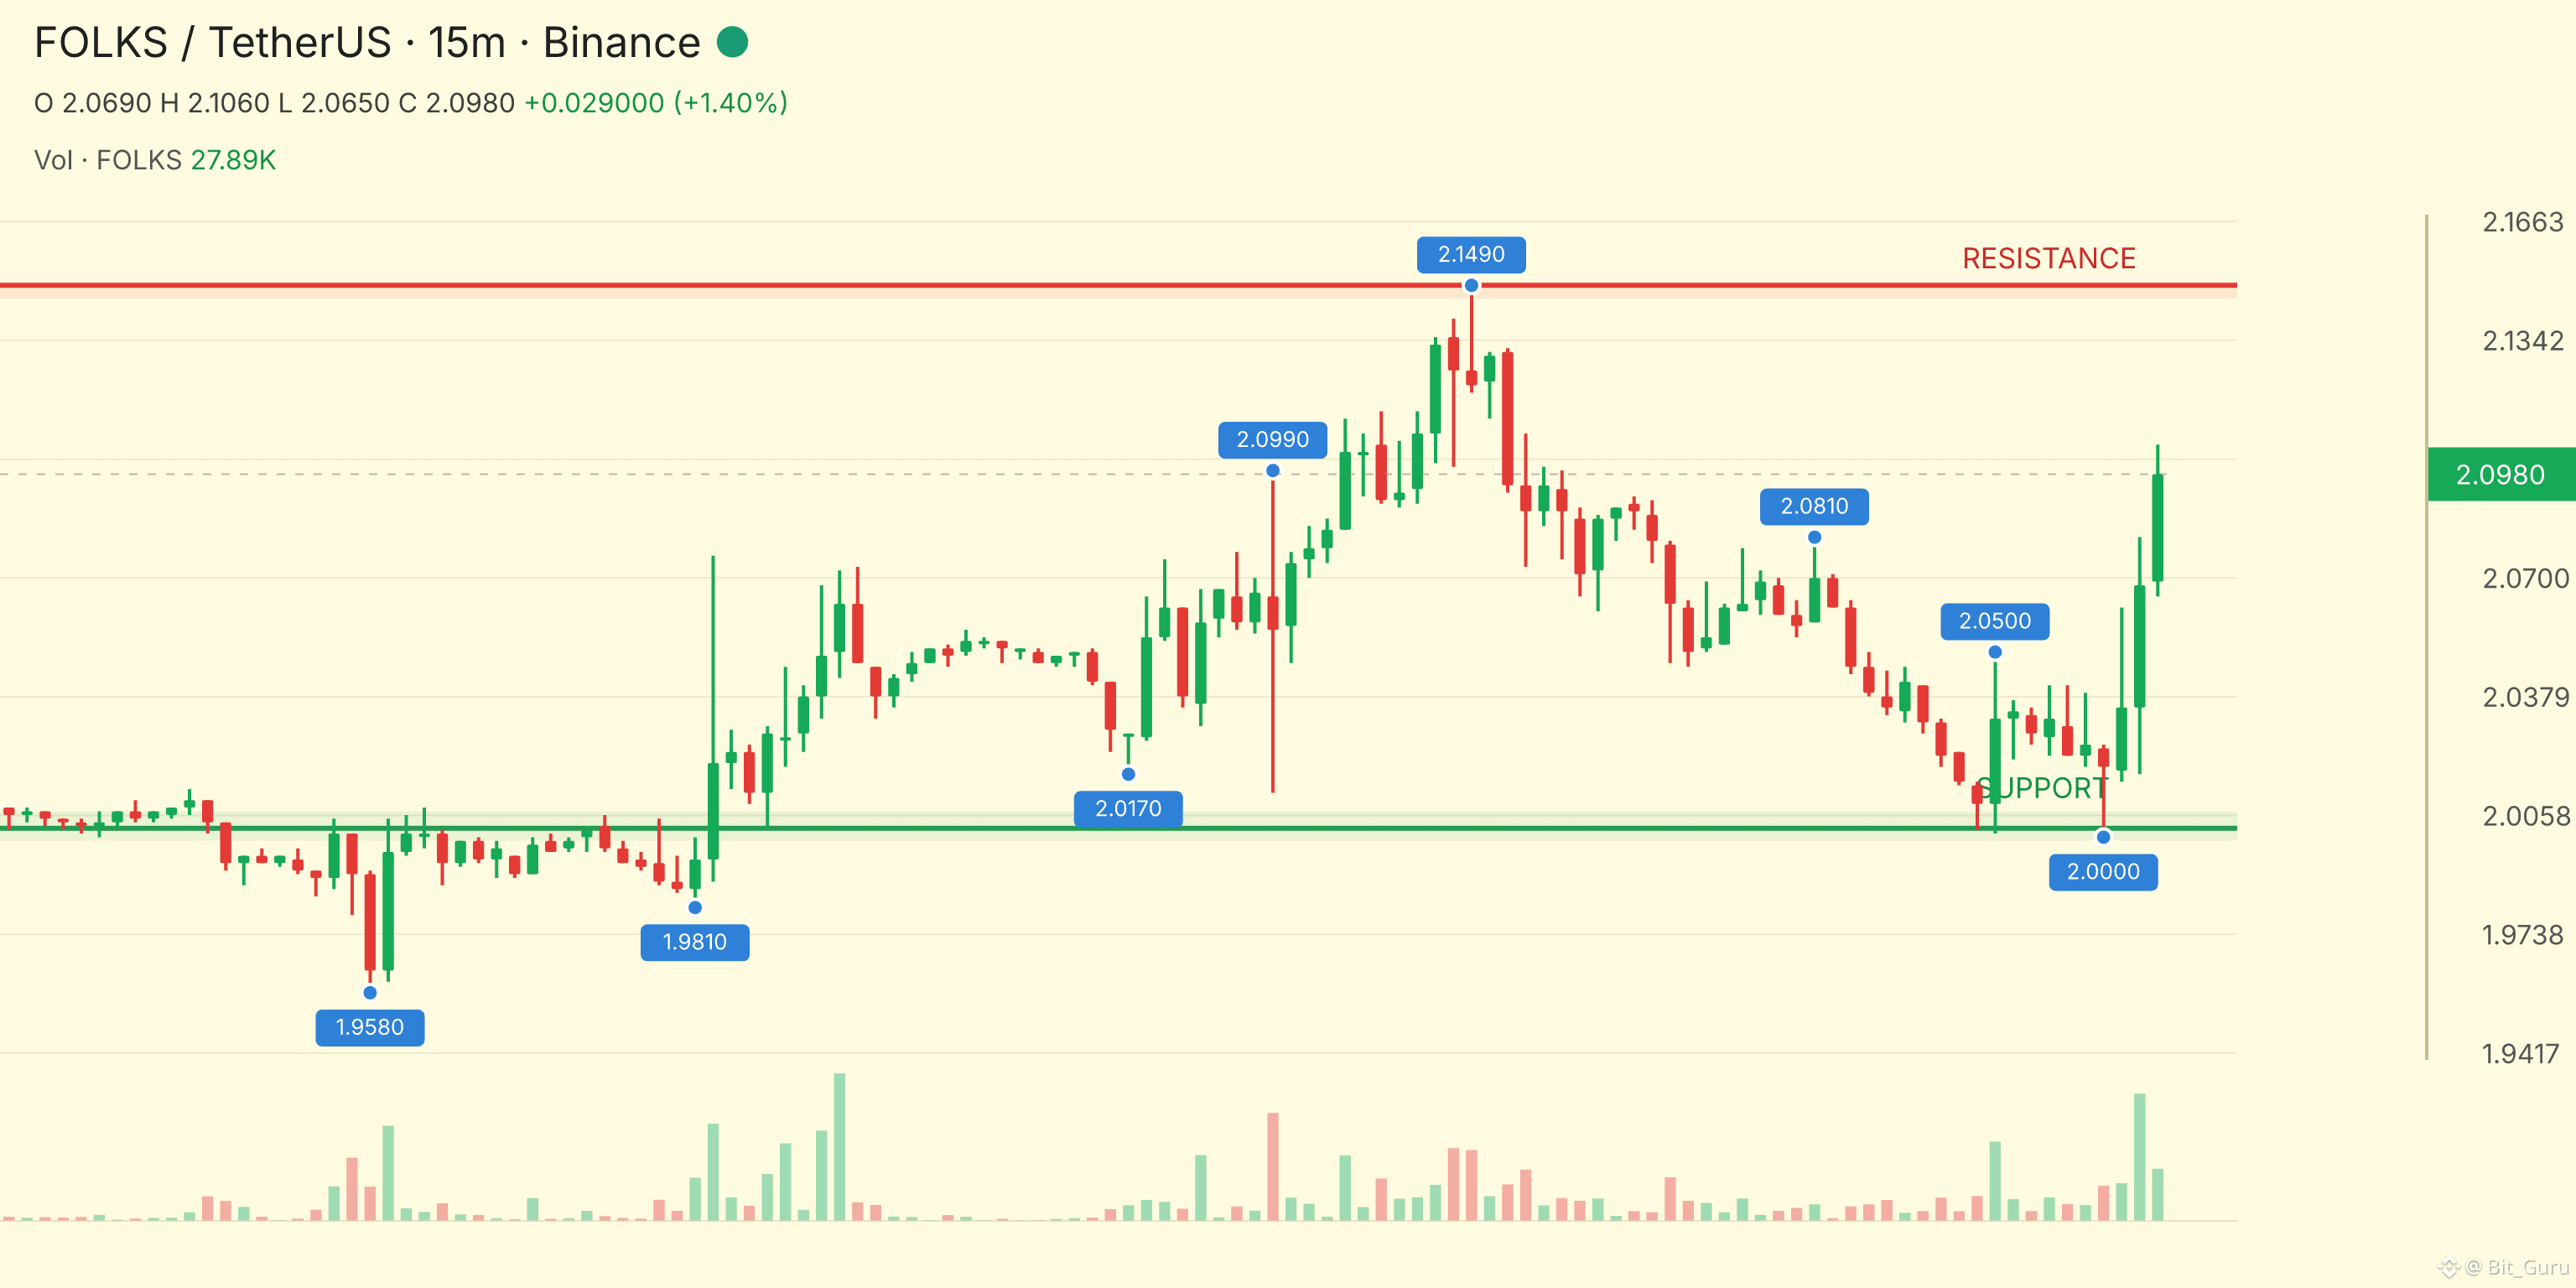
The Buyers Are Stepping In...!! $FOLKS is going UP...!!
ENTRY: 2.0988 - 2.1009
TP1: 2.1222
TP2: 2.1297
TP3: 2.1373...
The Buyers Are Stepping In...!! $FOLKS is going UP...!!
ENTRY: 2.0988 - 2.1009
TP1: 2.1222
TP2: 2.1297
TP3: 2.1373...
ENTRY: 2.0988 - 2.1009
TP1: 2.1222
TP2: 2.1297
TP3: 2.1373...
217
·
--
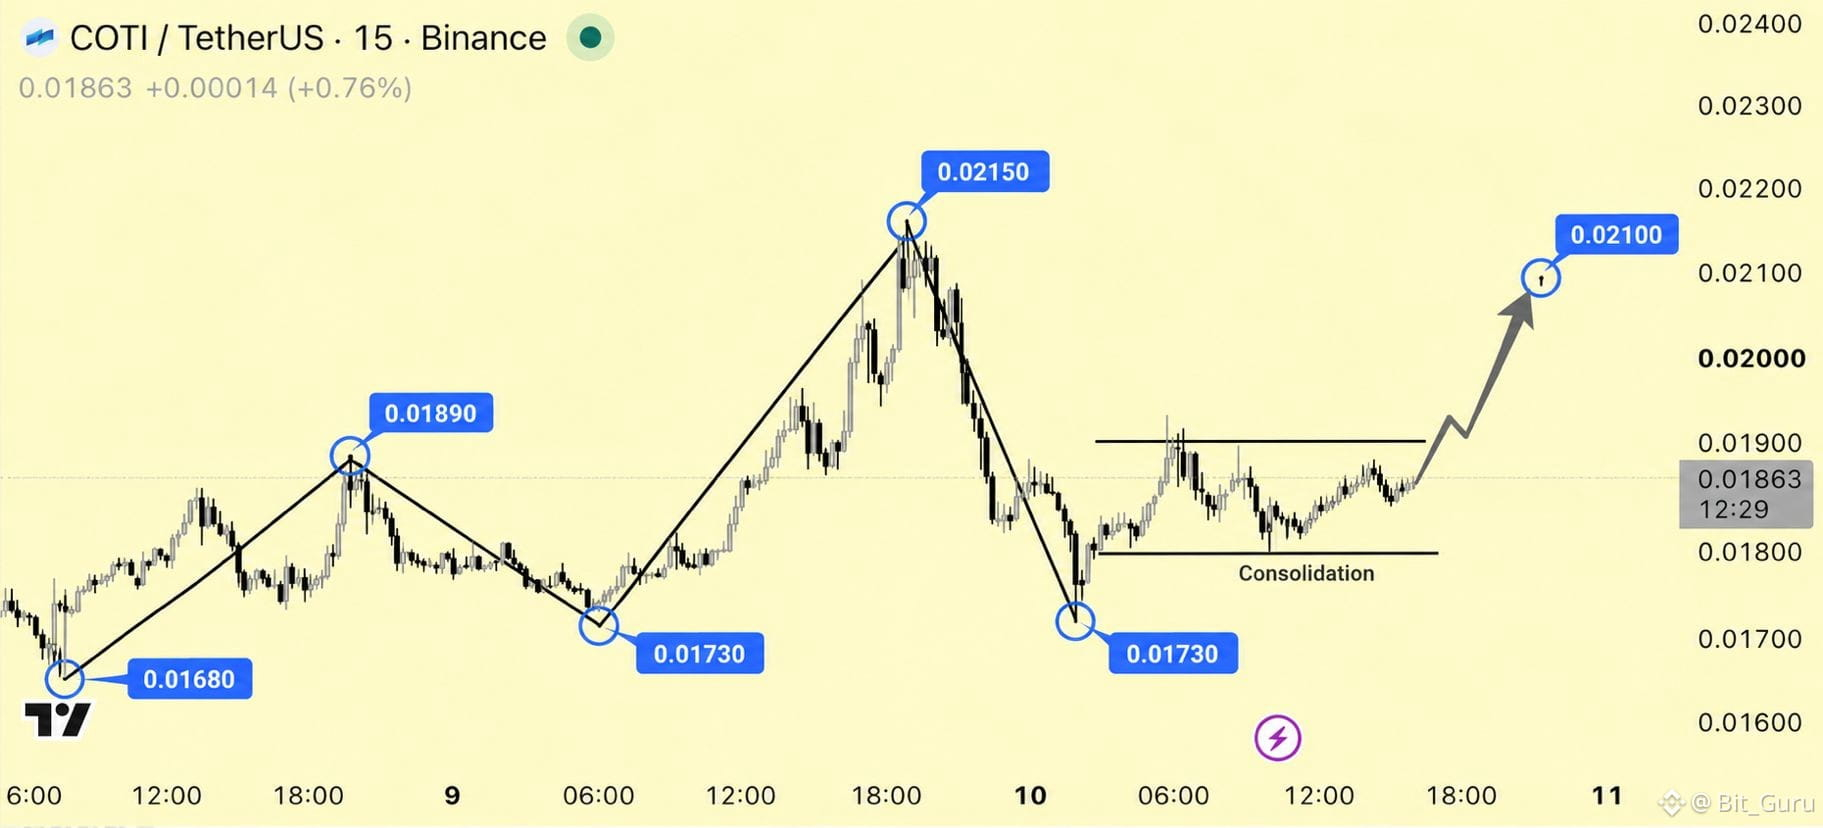
$COTI is consolidating near 0.01863 after holding the 0.01730 area. A breakout above the 0.01900 consolidation resistance could trigger the next bullish move toward 0.02100, while the current structure remains constructive as long as price holds above the recent 0.01730 swing low.
{future}(COTIUSDT)
$COTI is consolidating near 0.01863 after holding the 0.01730 area. A breakout above the 0.01900 consolidation resistance could trigger the next bullish move toward 0.02100, while the current structure remains constructive as long as price holds above the recent 0.01730 swing low.
1
128
·
--
Volume Is Building Across These 5 Coins and especially Dont ignore it my Community COTI is in fully pumping form..!!
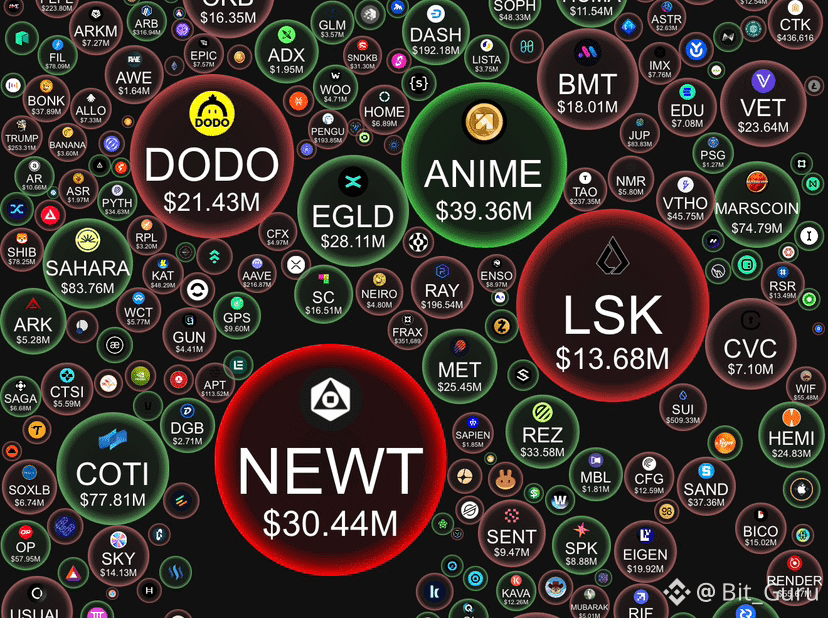
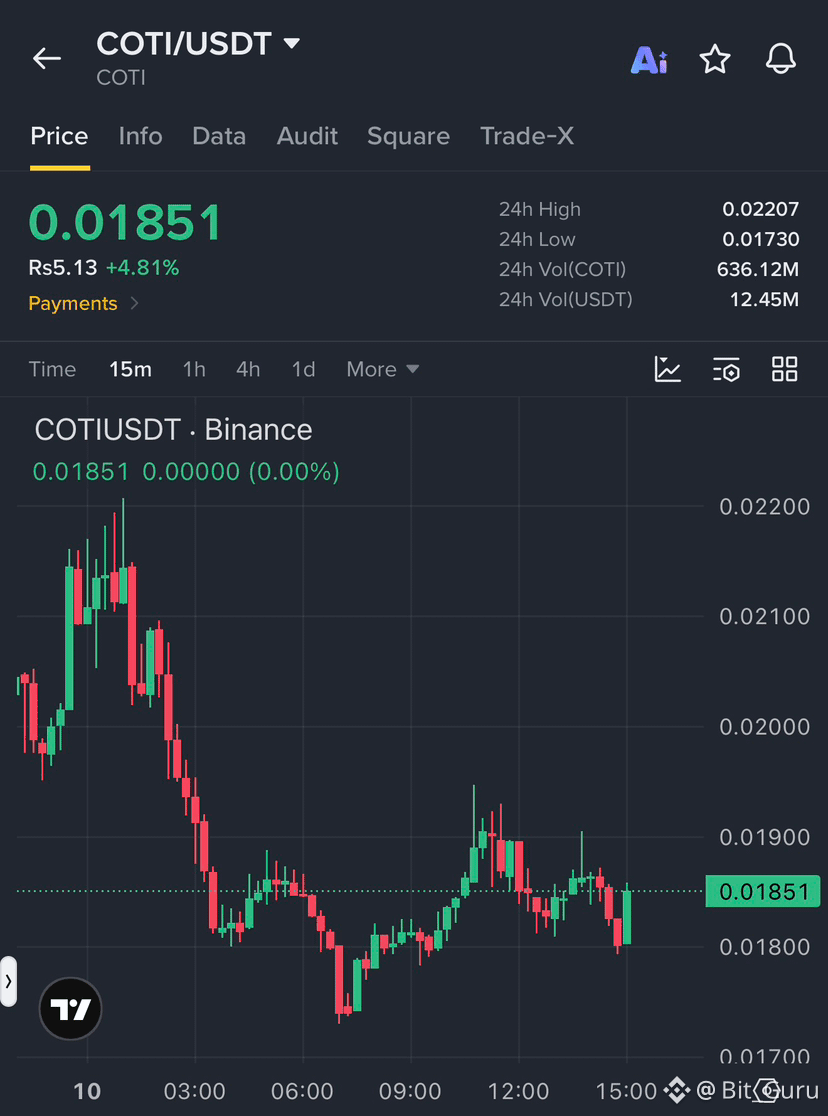
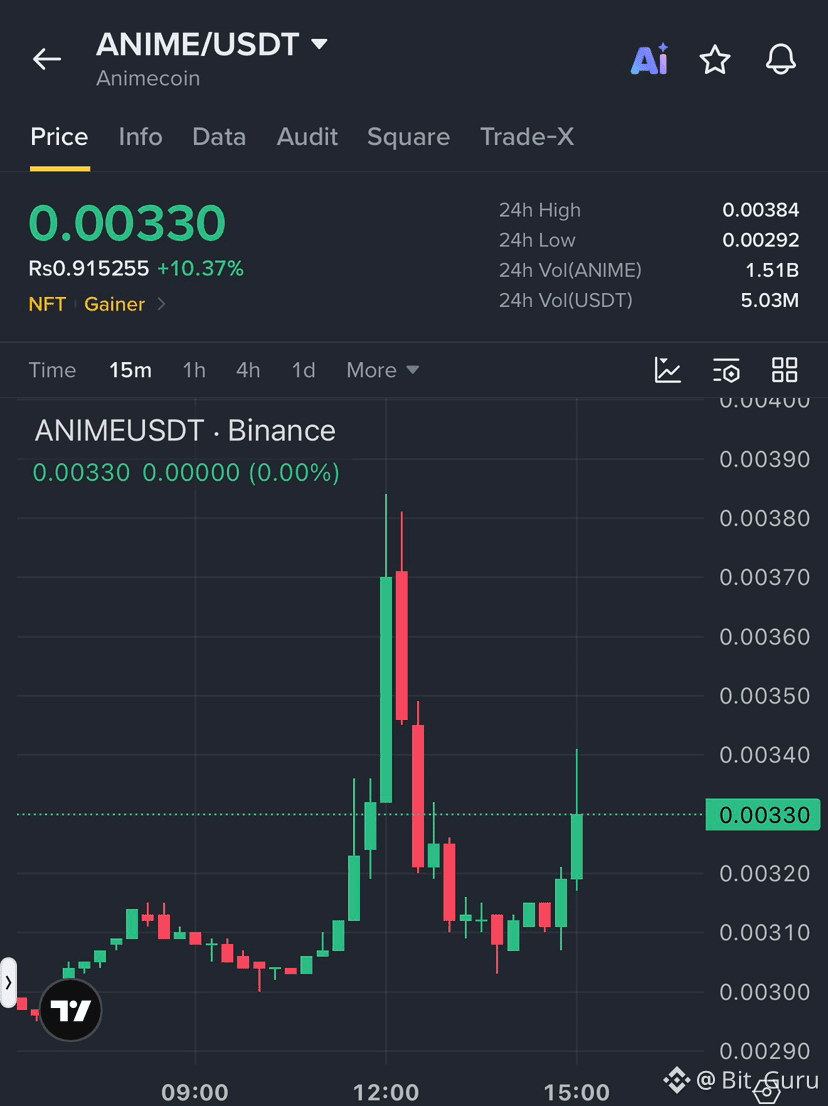
The latest market view shows strong activity in $ANIME , $COTI ,$SUI , #AAVE , and #DASH , with ANIME and COTI standing out on volume. ANIME is also showing a fresh bullish bounce, while COTI is holding above the $0.018 support area. If buyers keep control, these high-volume coins could lead the next upside move. For now, momentum looks bullish, but confirmation is still important.
{future}(SUIUSDT)
{future}(COTIUSDT)
{future}(ANIMEUSDT)
Volume Is Building Across These 5 Coins and especially Dont ignore it my Community COTI is in fully pumping form..!!
The latest market view shows strong activity in $ANIME , $COTI ,$SUI , #AAVE , and #DASH , with ANIME and COTI standing out on volume. ANIME is also showing a fresh bullish bounce, while COTI is holding above the $0.018 support area. If buyers keep control, these high-volume coins could lead the next upside move. For now, momentum looks bullish, but confirmation is still important.
The latest market view shows strong activity in $ANIME , $COTI ,$SUI , #AAVE , and #DASH , with ANIME and COTI standing out on volume. ANIME is also showing a fresh bullish bounce, while COTI is holding above the $0.018 support area. If buyers keep control, these high-volume coins could lead the next upside move. For now, momentum looks bullish, but confirmation is still important.
294
·
--
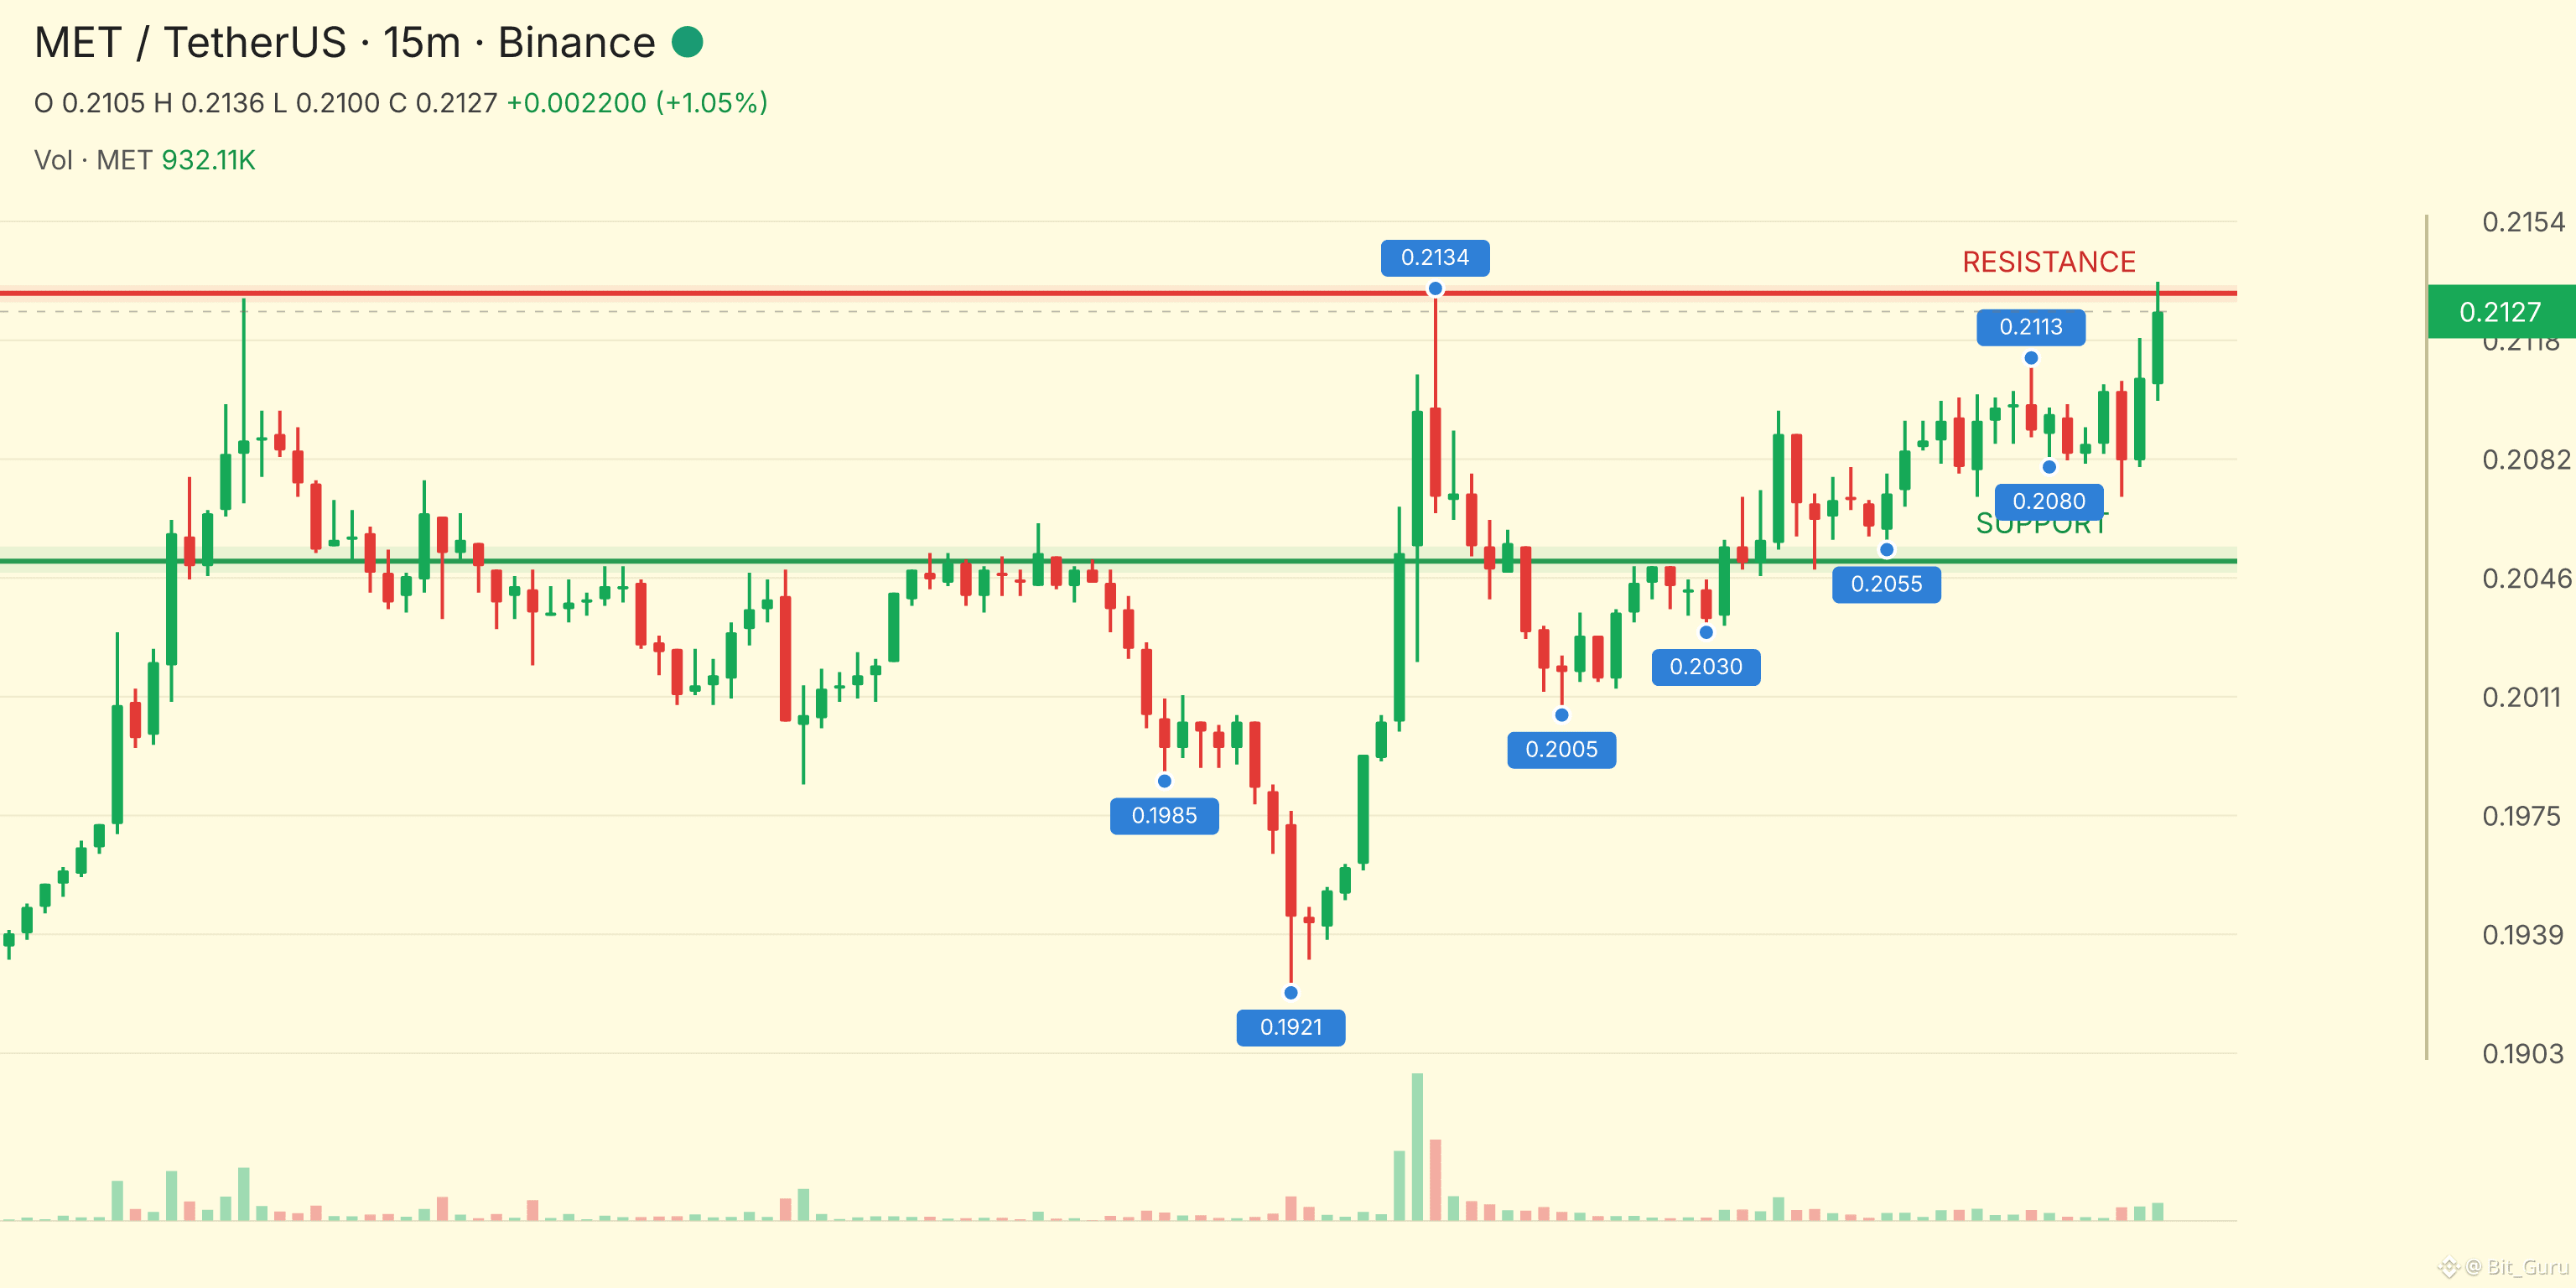
This Could Be The Next Move...!! $MET is going UP...!!
ENTRY: 0.21218 - 0.21239
TP1: 0.21454
TP2: 0.2153
TP3: 0.21607...
This Could Be The Next Move...!! $MET is going UP...!!
ENTRY: 0.21218 - 0.21239
TP1: 0.21454
TP2: 0.2153
TP3: 0.21607...
ENTRY: 0.21218 - 0.21239
TP1: 0.21454
TP2: 0.2153
TP3: 0.21607...
191
·
--
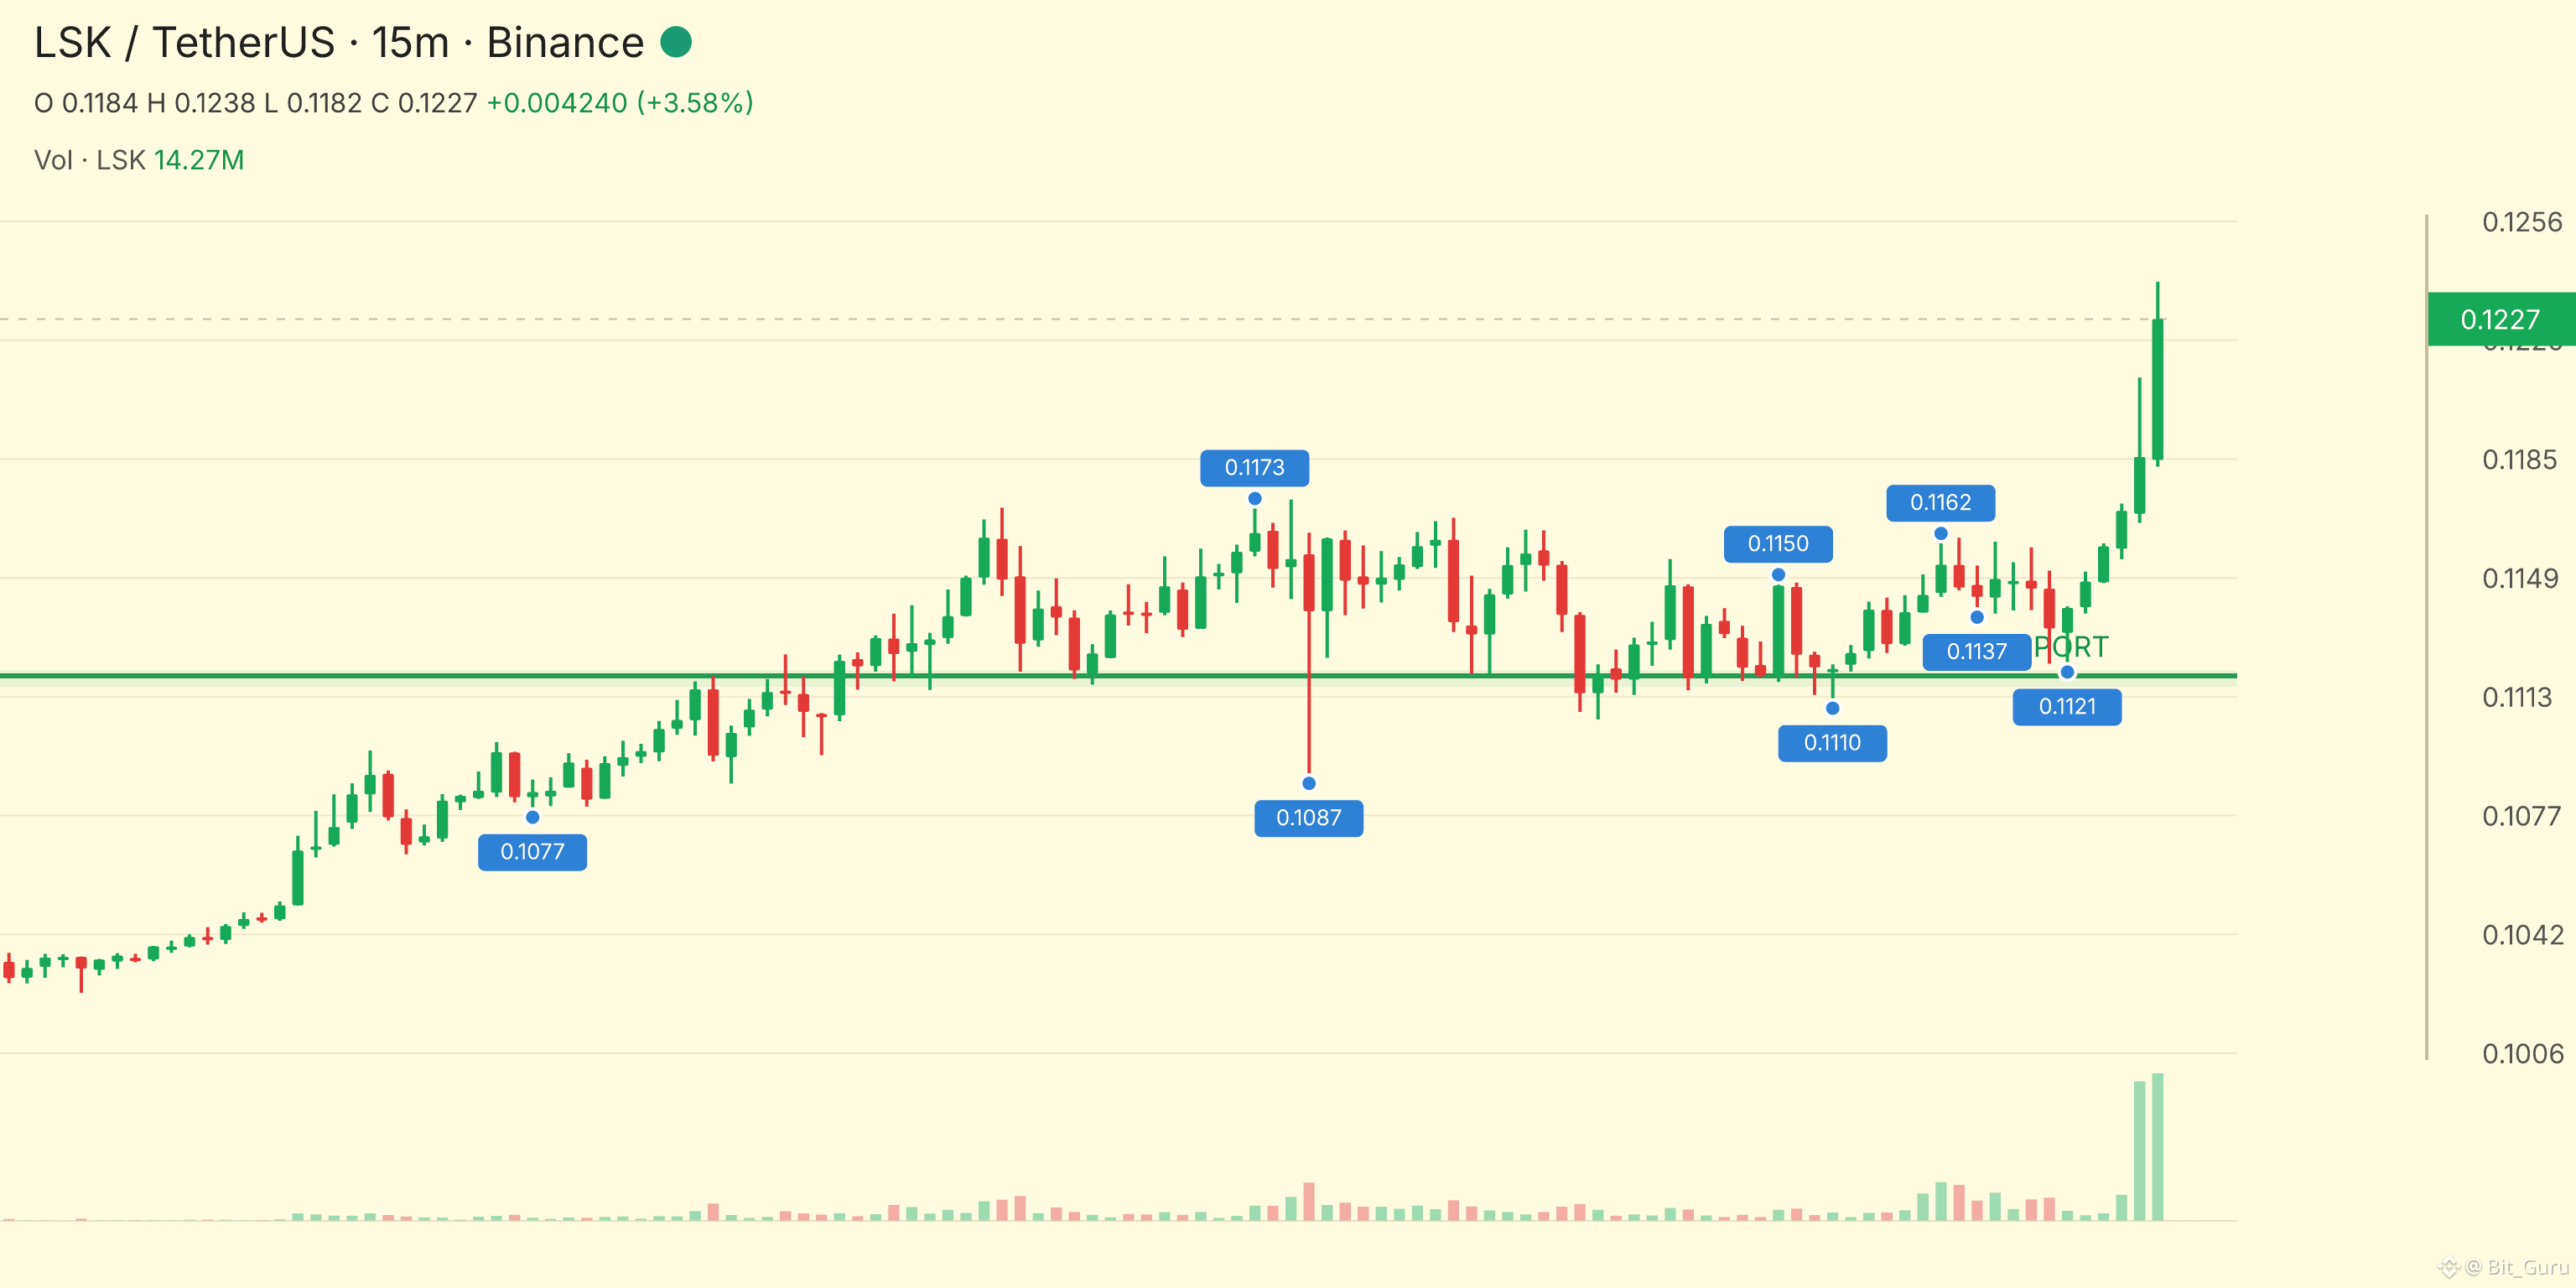
Fresh Momentum Is Here...!! $LSK is going UP...!!
ENTRY: 0.12297 - 0.12309
TP1: 0.12433
TP2: 0.12478
TP3: 0.12522...
Fresh Momentum Is Here...!! $LSK is going UP...!!
ENTRY: 0.12297 - 0.12309
TP1: 0.12433
TP2: 0.12478
TP3: 0.12522...
ENTRY: 0.12297 - 0.12309
TP1: 0.12433
TP2: 0.12478
TP3: 0.12522...
304
·
--
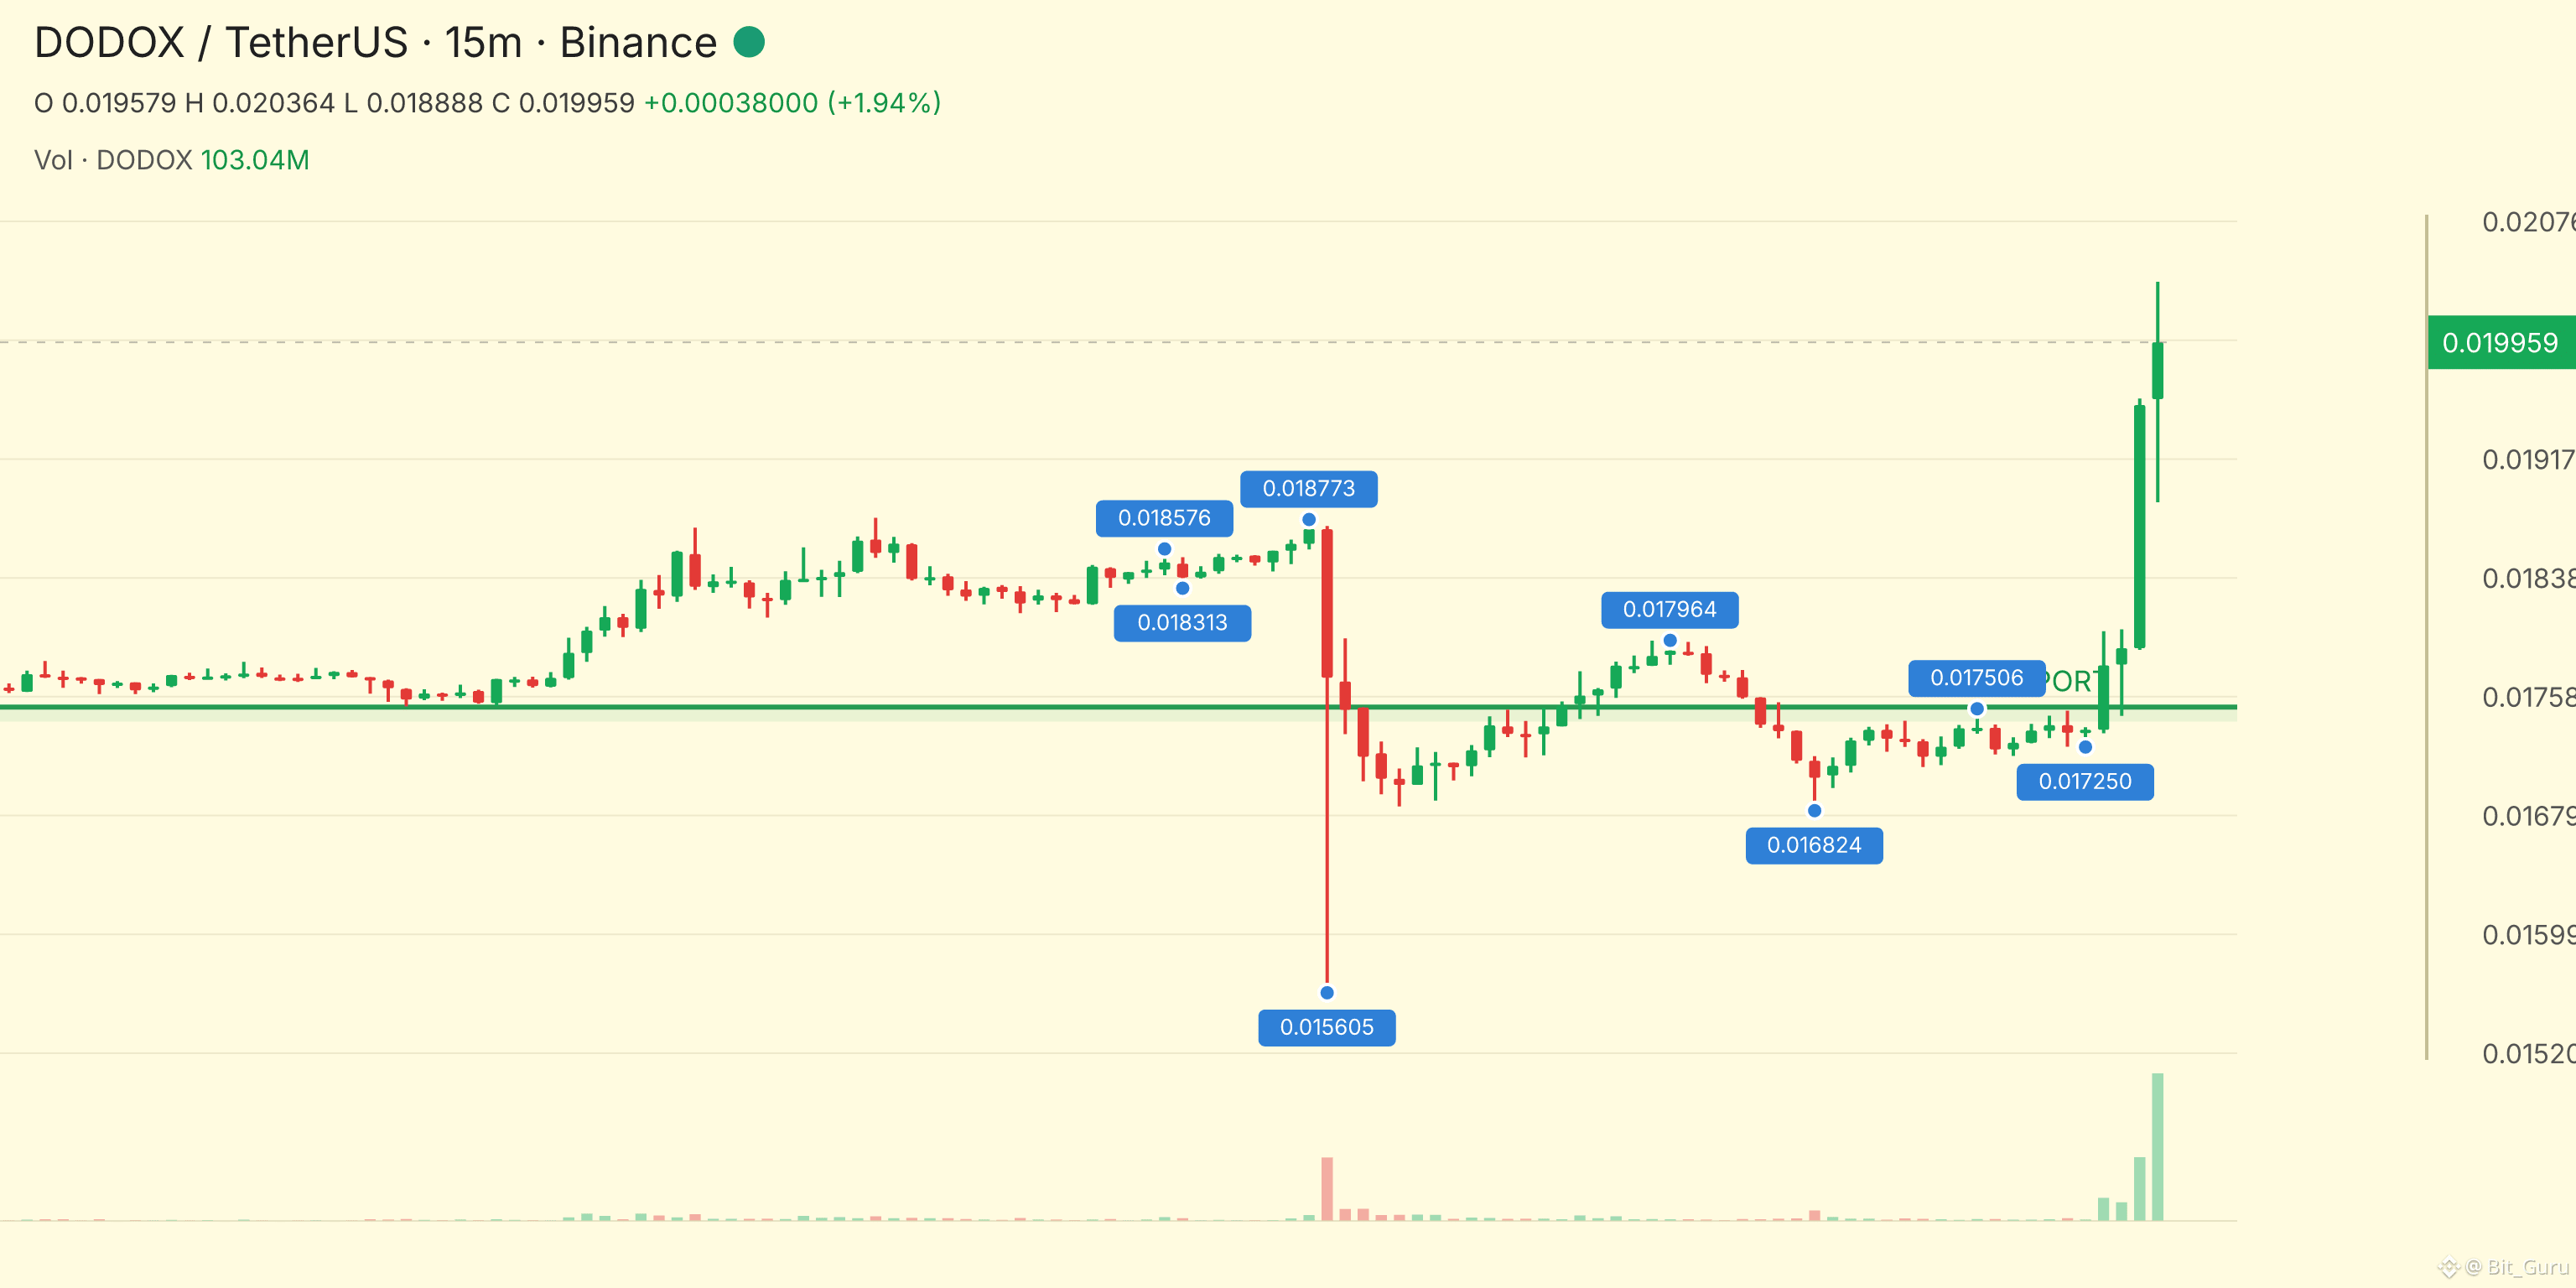
The Setup Is Getting Better...!! $DODOX is going UP...!!
ENTRY: 0.019942 - 0.019962
TP1: 0.020164
TP2: 0.020236
TP3: 0.020308...
The Setup Is Getting Better...!! $DODOX is going UP...!!
ENTRY: 0.019942 - 0.019962
TP1: 0.020164
TP2: 0.020236
TP3: 0.020308...
ENTRY: 0.019942 - 0.019962
TP1: 0.020164
TP2: 0.020236
TP3: 0.020308...
350
·
--
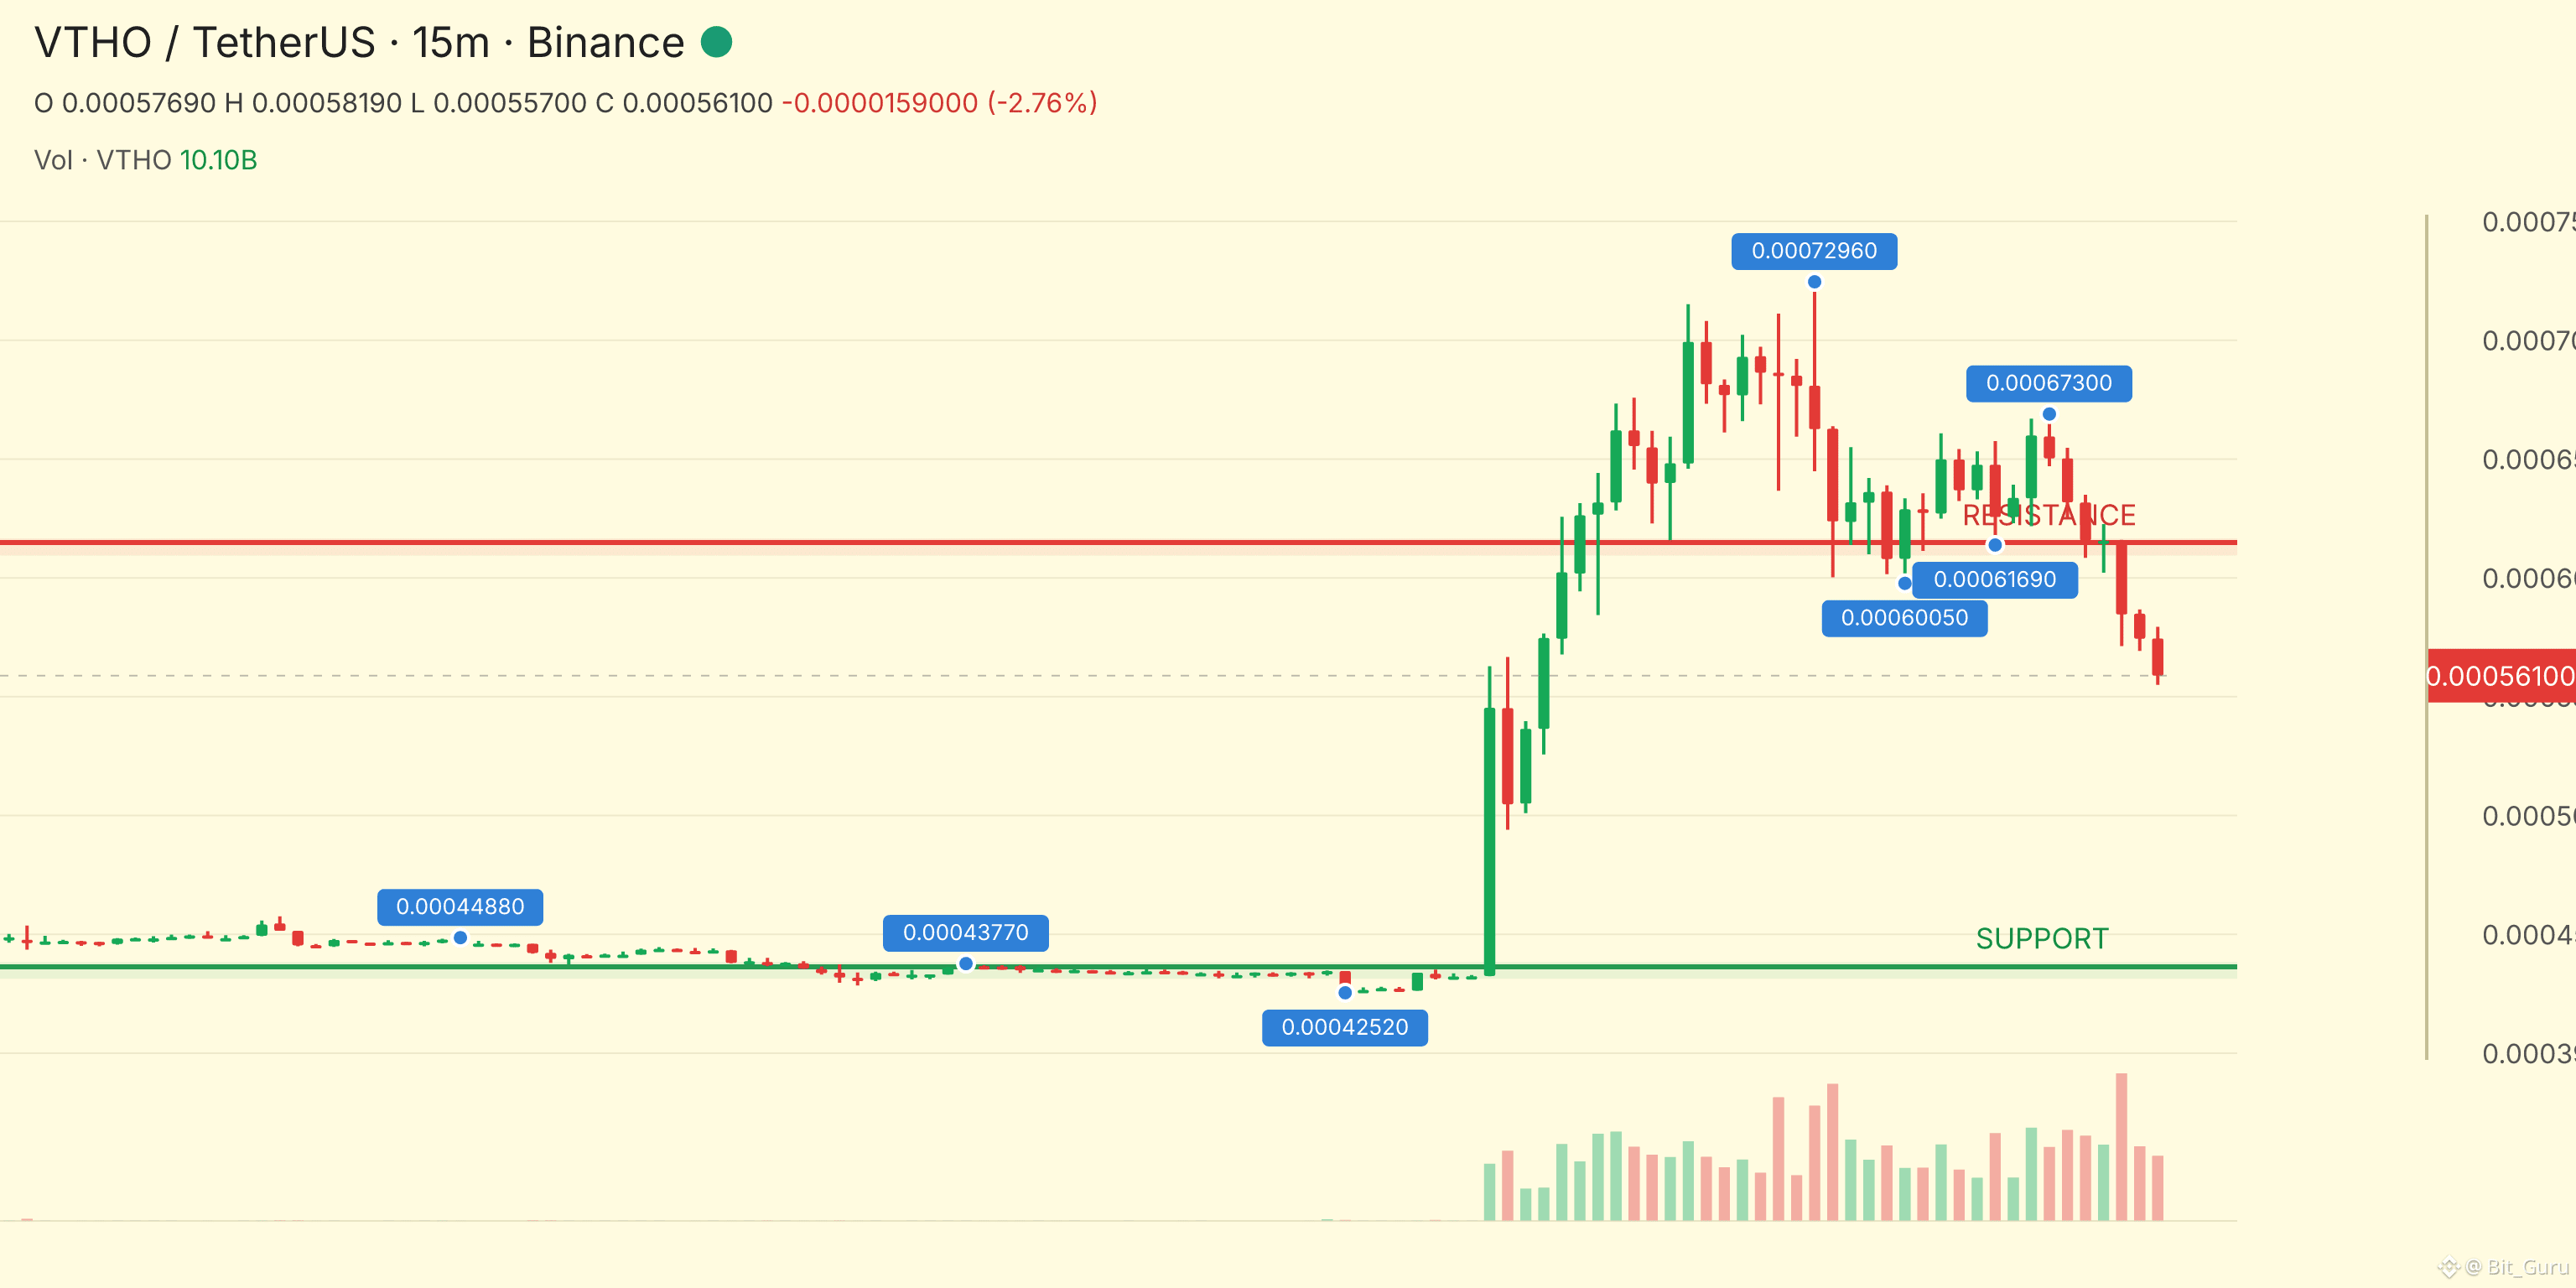
The Setup Is Getting Better...!! $VTHO is going DOWN...!!
ENTRY: 0.000559759 - 0.000560039
TP1: 0.000555218
TP2: 0.000553200
TP3: 0.000551182...
The Setup Is Getting Better...!! $VTHO is going DOWN...!!
ENTRY: 0.000559759 - 0.000560039
TP1: 0.000555218
TP2: 0.000553200
TP3: 0.000551182...
ENTRY: 0.000559759 - 0.000560039
TP1: 0.000555218
TP2: 0.000553200
TP3: 0.000551182...
1
317
·
--
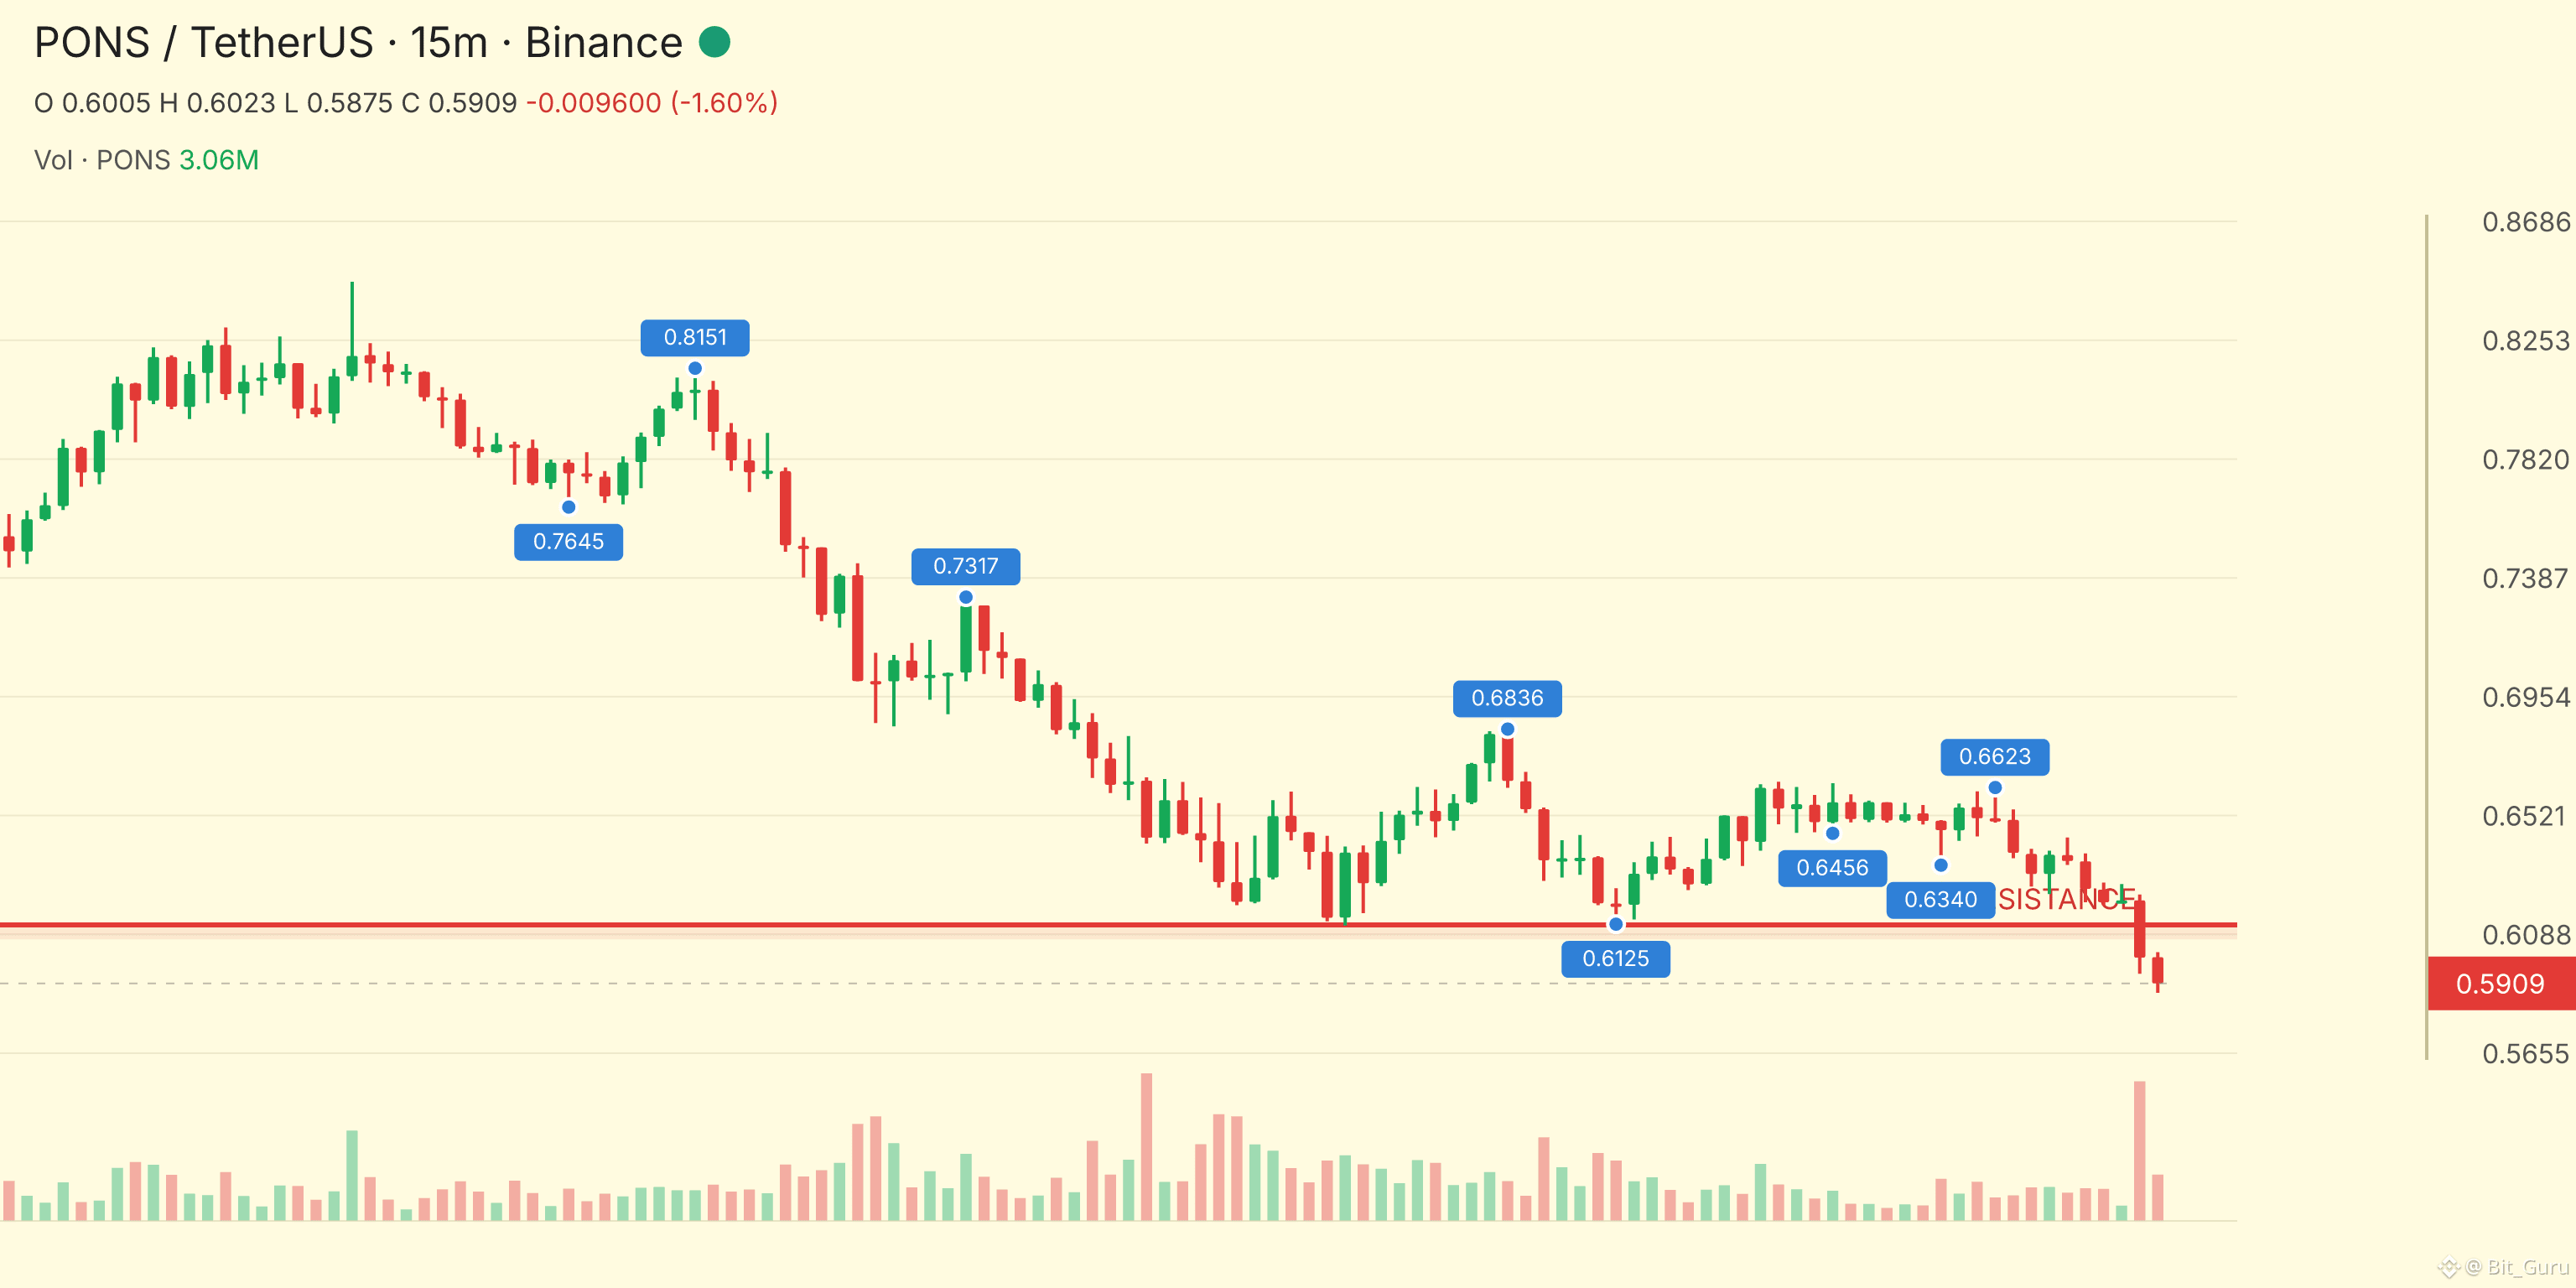
A Possible Breakout Is Near...!! $PONS is going DOWN...!!
ENTRY: 0.58902 - 0.58931
TP1: 0.58424
TP2: 0.58211
TP3: 0.57999...
A Possible Breakout Is Near...!! $PONS is going DOWN...!!
ENTRY: 0.58902 - 0.58931
TP1: 0.58424
TP2: 0.58211
TP3: 0.57999...
ENTRY: 0.58902 - 0.58931
TP1: 0.58424
TP2: 0.58211
TP3: 0.57999...
2
517
·
--
Bitcoin Funds See Second Straight Outflow as BTC Trades Near $78,000𝗕𝗶𝘁𝗰𝗼𝗶𝗻 𝗙𝘂𝗻𝗱 𝗙𝗹𝗼𝘄𝘀 𝗧𝘂𝗿𝗻 𝗡𝗲𝗴𝗮𝘁𝗶𝘃𝗲 𝗔𝗴𝗮𝗶𝗻
Bitcoin funds recorded a second consecutive day of net outflows on Wednesday, with approximately $120 million leaving the products, according to a CoinDesk market update. The reported outflow was more than twice Tuesday’s loss, making the latest figure notable even though the available data covers only two sessions.
The flow picture differed across major crypto-related products. Ether, XRP, and Solana funds recorded inflows during the same period, while bitcoin funds remained negative. That contrast indicates that the reported movement was concentrated in bitcoin-linked products rather than a simultaneous withdrawal from every category mentioned in the update.
The available information does not identify the individual bitcoin funds responsible for the outflows or explain why investors moved capital between the different product groups. As a result, the data establish a change in reported fund flows but do not establish the specific decisions or motivations behind those movements.
The flow update arrived during a weaker bitcoin trading session. In the supplied BTCUSDT market snapshot, bitcoin’s last price was $78,110.01, down $1,588.01, or 1.993%, over the measured 24-hour period. The market reached a high of $79,716 and a low of $77,770 before ending near $78,110.
𝗧𝗵𝗲 𝗠𝗮𝗿𝗸𝗲𝘁 𝗦𝗻𝗮𝗽𝘀𝗵𝗼𝘁
The BTCUSDT data show an opening price of $79,698.02 and a final price of $78,110.01 for the measured period. The weighted average price was $78,650.23, leaving the final price below that average. Bitcoin therefore ended the period lower than both its opening level and its weighted average, although those figures describe the supplied window only and do not determine a longer-term direction.
Trading was active throughout the session. Reported BTCUSDT volume reached 13,763.38627 BTC, with quote volume of approximately $1.082 billion. The snapshot recorded 3,248,716 trades. These figures show substantial activity during the decline, but they do not reveal whether the trading reflected long-position closures, new short positions, portfolio adjustments, or ordinary buying and selling between market participants.
The intraday path was uneven. Bitcoin initially traded near $79,000 and moved up to the session high of $79,716. It then moved through several lower price areas, reaching $77,770 at the session low. The market later recovered toward the $78,000 area but did not return to the opening level before the period ended.
The difference between the high and low was $1,946. That range illustrates the extent of the session’s movement without indicating what caused each price change. The supplied data show that buying appeared near the low, but the recovery was not sufficient to reverse the overall decline.
𝗛𝗼𝘄 𝘁𝗵𝗲 𝗙𝗹𝗼𝘄 𝗗𝗮𝘁𝗮 𝗖𝗼𝗺𝗽𝗮𝗿𝗲
The central feature of the latest report is the divergence between bitcoin funds and funds tied to ether, XRP, and Solana. Bitcoin products experienced a reported $120 million outflow on Wednesday, following an outflow on Tuesday. The other three categories, by contrast, recorded inflows during the same period.
This pattern presents a more selective picture than a broad withdrawal from the crypto products covered by the report. Capital was reported to be leaving bitcoin funds while entering the other named categories. However, the research does not provide the size of those inflows, the number of products involved, or a breakdown of the investors participating in the transactions.
Several interpretations remain possible, but they cannot be confirmed from the supplied information. The movement could reflect temporary changes in allocation, different preferences among investors, or reactions to price performance. It could also involve investors shifting exposure between product categories rather than adding or removing capital from the broader market. The available figures alone do not distinguish among these possibilities.
The divergence also limits the conclusions that can be drawn about overall market sentiment. Bitcoin was under pressure in the reported trading data, but inflows into ether, XRP, and Solana funds indicate that interest was not uniformly negative across every named product group. Whether that difference persists would require additional flow reports.
𝗪𝗵𝗮𝘁 𝗧𝘄𝗼 𝗗𝗮𝘆𝘀 𝗗𝗼 𝗮𝗻𝗱 𝗗𝗼 𝗡𝗼𝘁 𝗦𝗵𝗼𝘄
Two consecutive bitcoin-fund outflow days are a meaningful short-term observation, particularly because Wednesday’s reported loss was larger than Tuesday’s. They show that net flows were negative across both sessions. They do not, by themselves, establish a durable trend or demonstrate that investors have adopted a lasting negative view of bitcoin.
Fund flows can change from one reporting period to the next. A short sequence may reflect temporary repositioning, while a longer sequence could provide stronger evidence of a persistent change in demand. The research does not include enough historical flow information to determine where the latest two-day pattern fits within a broader trend.
The relationship between flows and price also requires care. The negative bitcoin-fund flows and the roughly 2% decline in BTCUSDT occurred during overlapping periods, but their timing does not prove that one caused the other. The supplied research does not identify the contribution of fund activity to spot-market selling, nor does it provide information about other potential sources of price movement.
The most supportable conclusion is narrower: bitcoin funds experienced two straight days of reported net outflows while bitcoin’s price declined during the supplied market window. That combination warrants attention, but it is not enough to establish causation or forecast the next move.
𝗧𝗵𝗲 𝗣𝗿𝗶𝗰𝗲 𝗥𝗮𝗻𝗴𝗲 𝗔𝗻𝗱 𝗧𝗿𝗮𝗱𝗶𝗻𝗴 𝗔𝗰𝘁𝗶𝘃𝗶𝘁𝘆
The session’s $77,770 low and $79,716 high define the immediate range visible in the supplied data. Bitcoin ended close to the lower portion of that range, at $78,110.01. The final price was approximately $340 above the low and $1,606 below the high.
The market’s movement through the range was not a single uninterrupted decline. Bitcoin first advanced from its opening area and reached the session high before moving lower. It later found trading interest near the low and recovered modestly. That sequence shows changing conditions within the session, rather than a market that moved in only one direction from the start.
The weighted average price of $78,650.23 provides another reference point. The closing price was about $540 below that average. This indicates that the final part of the measured period occurred below the session’s weighted average, but it does not independently establish that sellers will remain in control in a later period.
The reported quote volume of approximately $1.082 billion and more than 3.24 million trades confirm that the decline occurred alongside heavy activity. High activity can accompany disagreement among participants, but volume does not identify the reason for each transaction. It is therefore better treated as context for the price move rather than as a standalone explanation.
𝗧𝗵𝗲 𝗜𝗺𝗺𝗲𝗱𝗶𝗮𝘁𝗲 𝗥𝗶𝘀𝗸𝘀 𝗜𝗻 𝘁𝗵𝗲 𝗗𝗮𝘁𝗮
The first risk visible in the report is the possibility that bitcoin-fund outflows could continue. The research confirms only two consecutive negative sessions, so it does not show whether the pattern will extend. Additional negative reports would make the sequence longer, while a return to positive flows would change the immediate picture.
A second risk concerns the session low at $77,770. Bitcoin recovered from that level in the supplied snapshot but remained below its opening price at the end of the period. A later test of the low, or a move below it, would be new information and would need to be assessed when it occurs rather than assumed in advance.
A third risk is overinterpreting the relationship between fund flows and market price. Both negative bitcoin-fund flows and a falling BTCUSDT price appear in the available data, but the research does not establish that the fund flows caused the decline. Treating the reported outflows as the complete explanation would go beyond the evidence.
There is also uncertainty around the reported inflows into ether, XRP, and Solana funds. Those inflows show that the three categories turned positive during the period, but the research does not say whether they represented new capital, reallocations, or temporary positioning. Their significance cannot be measured fully without the amounts and additional days of data.
𝗪𝗵𝗮𝘁 𝗙𝘂𝘁𝘂𝗿𝗲 𝗗𝗮𝘁𝗮 𝗖𝗼𝘂𝗹𝗱 𝗖𝗵𝗮𝗻𝗴𝗲 𝘁𝗵𝗲 𝗣𝗶𝗰𝘁𝘂𝗿𝗲
The next reported bitcoin-fund flows will help show whether the latest two-day outflow is continuing or reversing. The size of any subsequent movement will also matter. A small outflow, a larger outflow, or a return to inflows would each provide a different signal from the current report.
Price behavior around the supplied range will offer another point of comparison. The market’s high was $79,716, while its low was $77,770. Future trading above, within, or below that range would add context to the current decline, but none of those outcomes can be established from the existing data.
The relative performance of the other named fund categories is also relevant. Continued inflows into ether, XRP, and Solana funds alongside bitcoin outflows would preserve the current divergence. If all four categories turned negative, the market picture would look broader than the one described in the latest report. If bitcoin flows improved while the other categories weakened, the reported allocation pattern would change again.
Further market data could also clarify whether the current activity reflects a sustained shift or a short-lived period of volatility. The available snapshot contains price, volume, and trade-count information, but it does not include a longer historical comparison. Additional observations would be needed to place the latest session in a broader context.
𝗔 𝗖𝗮𝘂𝘁𝗶𝗼𝘂𝘀 𝗥𝗲𝗮𝗱𝗶𝗻𝗴 𝗼𝗳 𝘁𝗵𝗲 𝗟𝗮𝘁𝗲𝘀𝘁 𝗗𝗮𝘁𝗮
The latest information presents a focused but limited warning for bitcoin’s near-term market conditions. Bitcoin funds recorded a second straight day of outflows, with Wednesday’s reported $120 million exit exceeding Tuesday’s loss. At the same time, ether, XRP, and Solana funds recorded inflows, producing a divided flow picture rather than a uniform move across the reported categories.
Bitcoin’s market performance was also weaker during the supplied measurement period. BTCUSDT opened near $79,698, reached a high of $79,716, fell to $77,770, and ended at $78,110.01. The price declined 1.993% over the period, while the weighted average price was $78,650.23. Trading activity exceeded 13,763 BTC in volume and approximately $1.082 billion in quote volume.
Taken together, the figures show short-term pressure and active repositioning, but they do not prove that a lasting downtrend has begun. The evidence supports a more measured conclusion: bitcoin demand was weaker during the observed period, while interest in the other named fund categories remained positive. Further flow reports and additional price data are necessary to determine whether the latest divergence is temporary or develops into a more persistent market pattern.
Bitcoin Funds See Second Straight Outflow as BTC Trades Near $78,000
𝗕𝗶𝘁𝗰𝗼𝗶𝗻 𝗙𝘂𝗻𝗱 𝗙𝗹𝗼𝘄𝘀 𝗧𝘂𝗿𝗻 𝗡𝗲𝗴𝗮𝘁𝗶𝘃𝗲 𝗔𝗴𝗮𝗶𝗻
Bitcoin funds recorded a second consecutive day of net outflows on Wednesday, with approximately $120 million leaving the products, according to a CoinDesk market update. The reported outflow was more than twice Tuesday’s loss, making the latest figure notable even though the available data covers only two sessions.
The flow picture differed across major crypto-related products. Ether, XRP, and Solana funds recorded inflows during the same period, while bitcoin funds remained negative. That contrast indicates that the reported movement was concentrated in bitcoin-linked products rather than a simultaneous withdrawal from every category mentioned in the update.
The available information does not identify the individual bitcoin funds responsible for the outflows or explain why investors moved capital between the different product groups. As a result, the data establish a change in reported fund flows but do not establish the specific decisions or motivations behind those movements.
The flow update arrived during a weaker bitcoin trading session. In the supplied BTCUSDT market snapshot, bitcoin’s last price was $78,110.01, down $1,588.01, or 1.993%, over the measured 24-hour period. The market reached a high of $79,716 and a low of $77,770 before ending near $78,110.
𝗧𝗵𝗲 𝗠𝗮𝗿𝗸𝗲𝘁 𝗦𝗻𝗮𝗽𝘀𝗵𝗼𝘁
The BTCUSDT data show an opening price of $79,698.02 and a final price of $78,110.01 for the measured period. The weighted average price was $78,650.23, leaving the final price below that average. Bitcoin therefore ended the period lower than both its opening level and its weighted average, although those figures describe the supplied window only and do not determine a longer-term direction.
Trading was active throughout the session. Reported BTCUSDT volume reached 13,763.38627 BTC, with quote volume of approximately $1.082 billion. The snapshot recorded 3,248,716 trades. These figures show substantial activity during the decline, but they do not reveal whether the trading reflected long-position closures, new short positions, portfolio adjustments, or ordinary buying and selling between market participants.
The intraday path was uneven. Bitcoin initially traded near $79,000 and moved up to the session high of $79,716. It then moved through several lower price areas, reaching $77,770 at the session low. The market later recovered toward the $78,000 area but did not return to the opening level before the period ended.
The difference between the high and low was $1,946. That range illustrates the extent of the session’s movement without indicating what caused each price change. The supplied data show that buying appeared near the low, but the recovery was not sufficient to reverse the overall decline.
𝗛𝗼𝘄 𝘁𝗵𝗲 𝗙𝗹𝗼𝘄 𝗗𝗮𝘁𝗮 𝗖𝗼𝗺𝗽𝗮𝗿𝗲
The central feature of the latest report is the divergence between bitcoin funds and funds tied to ether, XRP, and Solana. Bitcoin products experienced a reported $120 million outflow on Wednesday, following an outflow on Tuesday. The other three categories, by contrast, recorded inflows during the same period.
This pattern presents a more selective picture than a broad withdrawal from the crypto products covered by the report. Capital was reported to be leaving bitcoin funds while entering the other named categories. However, the research does not provide the size of those inflows, the number of products involved, or a breakdown of the investors participating in the transactions.
Several interpretations remain possible, but they cannot be confirmed from the supplied information. The movement could reflect temporary changes in allocation, different preferences among investors, or reactions to price performance. It could also involve investors shifting exposure between product categories rather than adding or removing capital from the broader market. The available figures alone do not distinguish among these possibilities.
The divergence also limits the conclusions that can be drawn about overall market sentiment. Bitcoin was under pressure in the reported trading data, but inflows into ether, XRP, and Solana funds indicate that interest was not uniformly negative across every named product group. Whether that difference persists would require additional flow reports.
𝗪𝗵𝗮𝘁 𝗧𝘄𝗼 𝗗𝗮𝘆𝘀 𝗗𝗼 𝗮𝗻𝗱 𝗗𝗼 𝗡𝗼𝘁 𝗦𝗵𝗼𝘄
Two consecutive bitcoin-fund outflow days are a meaningful short-term observation, particularly because Wednesday’s reported loss was larger than Tuesday’s. They show that net flows were negative across both sessions. They do not, by themselves, establish a durable trend or demonstrate that investors have adopted a lasting negative view of bitcoin.
Fund flows can change from one reporting period to the next. A short sequence may reflect temporary repositioning, while a longer sequence could provide stronger evidence of a persistent change in demand. The research does not include enough historical flow information to determine where the latest two-day pattern fits within a broader trend.
The relationship between flows and price also requires care. The negative bitcoin-fund flows and the roughly 2% decline in BTCUSDT occurred during overlapping periods, but their timing does not prove that one caused the other. The supplied research does not identify the contribution of fund activity to spot-market selling, nor does it provide information about other potential sources of price movement.
The most supportable conclusion is narrower: bitcoin funds experienced two straight days of reported net outflows while bitcoin’s price declined during the supplied market window. That combination warrants attention, but it is not enough to establish causation or forecast the next move.
𝗧𝗵𝗲 𝗣𝗿𝗶𝗰𝗲 𝗥𝗮𝗻𝗴𝗲 𝗔𝗻𝗱 𝗧𝗿𝗮𝗱𝗶𝗻𝗴 𝗔𝗰𝘁𝗶𝘃𝗶𝘁𝘆
The session’s $77,770 low and $79,716 high define the immediate range visible in the supplied data. Bitcoin ended close to the lower portion of that range, at $78,110.01. The final price was approximately $340 above the low and $1,606 below the high.
The market’s movement through the range was not a single uninterrupted decline. Bitcoin first advanced from its opening area and reached the session high before moving lower. It later found trading interest near the low and recovered modestly. That sequence shows changing conditions within the session, rather than a market that moved in only one direction from the start.
The weighted average price of $78,650.23 provides another reference point. The closing price was about $540 below that average. This indicates that the final part of the measured period occurred below the session’s weighted average, but it does not independently establish that sellers will remain in control in a later period.
The reported quote volume of approximately $1.082 billion and more than 3.24 million trades confirm that the decline occurred alongside heavy activity. High activity can accompany disagreement among participants, but volume does not identify the reason for each transaction. It is therefore better treated as context for the price move rather than as a standalone explanation.
𝗧𝗵𝗲 𝗜𝗺𝗺𝗲𝗱𝗶𝗮𝘁𝗲 𝗥𝗶𝘀𝗸𝘀 𝗜𝗻 𝘁𝗵𝗲 𝗗𝗮𝘁𝗮
The first risk visible in the report is the possibility that bitcoin-fund outflows could continue. The research confirms only two consecutive negative sessions, so it does not show whether the pattern will extend. Additional negative reports would make the sequence longer, while a return to positive flows would change the immediate picture.
A second risk concerns the session low at $77,770. Bitcoin recovered from that level in the supplied snapshot but remained below its opening price at the end of the period. A later test of the low, or a move below it, would be new information and would need to be assessed when it occurs rather than assumed in advance.
A third risk is overinterpreting the relationship between fund flows and market price. Both negative bitcoin-fund flows and a falling BTCUSDT price appear in the available data, but the research does not establish that the fund flows caused the decline. Treating the reported outflows as the complete explanation would go beyond the evidence.
There is also uncertainty around the reported inflows into ether, XRP, and Solana funds. Those inflows show that the three categories turned positive during the period, but the research does not say whether they represented new capital, reallocations, or temporary positioning. Their significance cannot be measured fully without the amounts and additional days of data.
𝗪𝗵𝗮𝘁 𝗙𝘂𝘁𝘂𝗿𝗲 𝗗𝗮𝘁𝗮 𝗖𝗼𝘂𝗹𝗱 𝗖𝗵𝗮𝗻𝗴𝗲 𝘁𝗵𝗲 𝗣𝗶𝗰𝘁𝘂𝗿𝗲
The next reported bitcoin-fund flows will help show whether the latest two-day outflow is continuing or reversing. The size of any subsequent movement will also matter. A small outflow, a larger outflow, or a return to inflows would each provide a different signal from the current report.
Price behavior around the supplied range will offer another point of comparison. The market’s high was $79,716, while its low was $77,770. Future trading above, within, or below that range would add context to the current decline, but none of those outcomes can be established from the existing data.
The relative performance of the other named fund categories is also relevant. Continued inflows into ether, XRP, and Solana funds alongside bitcoin outflows would preserve the current divergence. If all four categories turned negative, the market picture would look broader than the one described in the latest report. If bitcoin flows improved while the other categories weakened, the reported allocation pattern would change again.
Further market data could also clarify whether the current activity reflects a sustained shift or a short-lived period of volatility. The available snapshot contains price, volume, and trade-count information, but it does not include a longer historical comparison. Additional observations would be needed to place the latest session in a broader context.
𝗔 𝗖𝗮𝘂𝘁𝗶𝗼𝘂𝘀 𝗥𝗲𝗮𝗱𝗶𝗻𝗴 𝗼𝗳 𝘁𝗵𝗲 𝗟𝗮𝘁𝗲𝘀𝘁 𝗗𝗮𝘁𝗮
The latest information presents a focused but limited warning for bitcoin’s near-term market conditions. Bitcoin funds recorded a second straight day of outflows, with Wednesday’s reported $120 million exit exceeding Tuesday’s loss. At the same time, ether, XRP, and Solana funds recorded inflows, producing a divided flow picture rather than a uniform move across the reported categories.
Bitcoin’s market performance was also weaker during the supplied measurement period. BTCUSDT opened near $79,698, reached a high of $79,716, fell to $77,770, and ended at $78,110.01. The price declined 1.993% over the period, while the weighted average price was $78,650.23. Trading activity exceeded 13,763 BTC in volume and approximately $1.082 billion in quote volume.
Taken together, the figures show short-term pressure and active repositioning, but they do not prove that a lasting downtrend has begun. The evidence supports a more measured conclusion: bitcoin demand was weaker during the observed period, while interest in the other named fund categories remained positive. Further flow reports and additional price data are necessary to determine whether the latest divergence is temporary or develops into a more persistent market pattern.
Bitcoin funds recorded a second consecutive day of net outflows on Wednesday, with approximately $120 million leaving the products, according to a CoinDesk market update. The reported outflow was more than twice Tuesday’s loss, making the latest figure notable even though the available data covers only two sessions.
The flow picture differed across major crypto-related products. Ether, XRP, and Solana funds recorded inflows during the same period, while bitcoin funds remained negative. That contrast indicates that the reported movement was concentrated in bitcoin-linked products rather than a simultaneous withdrawal from every category mentioned in the update.
The available information does not identify the individual bitcoin funds responsible for the outflows or explain why investors moved capital between the different product groups. As a result, the data establish a change in reported fund flows but do not establish the specific decisions or motivations behind those movements.
The flow update arrived during a weaker bitcoin trading session. In the supplied BTCUSDT market snapshot, bitcoin’s last price was $78,110.01, down $1,588.01, or 1.993%, over the measured 24-hour period. The market reached a high of $79,716 and a low of $77,770 before ending near $78,110.
𝗧𝗵𝗲 𝗠𝗮𝗿𝗸𝗲𝘁 𝗦𝗻𝗮𝗽𝘀𝗵𝗼𝘁
The BTCUSDT data show an opening price of $79,698.02 and a final price of $78,110.01 for the measured period. The weighted average price was $78,650.23, leaving the final price below that average. Bitcoin therefore ended the period lower than both its opening level and its weighted average, although those figures describe the supplied window only and do not determine a longer-term direction.
Trading was active throughout the session. Reported BTCUSDT volume reached 13,763.38627 BTC, with quote volume of approximately $1.082 billion. The snapshot recorded 3,248,716 trades. These figures show substantial activity during the decline, but they do not reveal whether the trading reflected long-position closures, new short positions, portfolio adjustments, or ordinary buying and selling between market participants.
The intraday path was uneven. Bitcoin initially traded near $79,000 and moved up to the session high of $79,716. It then moved through several lower price areas, reaching $77,770 at the session low. The market later recovered toward the $78,000 area but did not return to the opening level before the period ended.
The difference between the high and low was $1,946. That range illustrates the extent of the session’s movement without indicating what caused each price change. The supplied data show that buying appeared near the low, but the recovery was not sufficient to reverse the overall decline.
𝗛𝗼𝘄 𝘁𝗵𝗲 𝗙𝗹𝗼𝘄 𝗗𝗮𝘁𝗮 𝗖𝗼𝗺𝗽𝗮𝗿𝗲
The central feature of the latest report is the divergence between bitcoin funds and funds tied to ether, XRP, and Solana. Bitcoin products experienced a reported $120 million outflow on Wednesday, following an outflow on Tuesday. The other three categories, by contrast, recorded inflows during the same period.
This pattern presents a more selective picture than a broad withdrawal from the crypto products covered by the report. Capital was reported to be leaving bitcoin funds while entering the other named categories. However, the research does not provide the size of those inflows, the number of products involved, or a breakdown of the investors participating in the transactions.
Several interpretations remain possible, but they cannot be confirmed from the supplied information. The movement could reflect temporary changes in allocation, different preferences among investors, or reactions to price performance. It could also involve investors shifting exposure between product categories rather than adding or removing capital from the broader market. The available figures alone do not distinguish among these possibilities.
The divergence also limits the conclusions that can be drawn about overall market sentiment. Bitcoin was under pressure in the reported trading data, but inflows into ether, XRP, and Solana funds indicate that interest was not uniformly negative across every named product group. Whether that difference persists would require additional flow reports.
𝗪𝗵𝗮𝘁 𝗧𝘄𝗼 𝗗𝗮𝘆𝘀 𝗗𝗼 𝗮𝗻𝗱 𝗗𝗼 𝗡𝗼𝘁 𝗦𝗵𝗼𝘄
Two consecutive bitcoin-fund outflow days are a meaningful short-term observation, particularly because Wednesday’s reported loss was larger than Tuesday’s. They show that net flows were negative across both sessions. They do not, by themselves, establish a durable trend or demonstrate that investors have adopted a lasting negative view of bitcoin.
Fund flows can change from one reporting period to the next. A short sequence may reflect temporary repositioning, while a longer sequence could provide stronger evidence of a persistent change in demand. The research does not include enough historical flow information to determine where the latest two-day pattern fits within a broader trend.
The relationship between flows and price also requires care. The negative bitcoin-fund flows and the roughly 2% decline in BTCUSDT occurred during overlapping periods, but their timing does not prove that one caused the other. The supplied research does not identify the contribution of fund activity to spot-market selling, nor does it provide information about other potential sources of price movement.
The most supportable conclusion is narrower: bitcoin funds experienced two straight days of reported net outflows while bitcoin’s price declined during the supplied market window. That combination warrants attention, but it is not enough to establish causation or forecast the next move.
𝗧𝗵𝗲 𝗣𝗿𝗶𝗰𝗲 𝗥𝗮𝗻𝗴𝗲 𝗔𝗻𝗱 𝗧𝗿𝗮𝗱𝗶𝗻𝗴 𝗔𝗰𝘁𝗶𝘃𝗶𝘁𝘆
The session’s $77,770 low and $79,716 high define the immediate range visible in the supplied data. Bitcoin ended close to the lower portion of that range, at $78,110.01. The final price was approximately $340 above the low and $1,606 below the high.
The market’s movement through the range was not a single uninterrupted decline. Bitcoin first advanced from its opening area and reached the session high before moving lower. It later found trading interest near the low and recovered modestly. That sequence shows changing conditions within the session, rather than a market that moved in only one direction from the start.
The weighted average price of $78,650.23 provides another reference point. The closing price was about $540 below that average. This indicates that the final part of the measured period occurred below the session’s weighted average, but it does not independently establish that sellers will remain in control in a later period.
The reported quote volume of approximately $1.082 billion and more than 3.24 million trades confirm that the decline occurred alongside heavy activity. High activity can accompany disagreement among participants, but volume does not identify the reason for each transaction. It is therefore better treated as context for the price move rather than as a standalone explanation.
𝗧𝗵𝗲 𝗜𝗺𝗺𝗲𝗱𝗶𝗮𝘁𝗲 𝗥𝗶𝘀𝗸𝘀 𝗜𝗻 𝘁𝗵𝗲 𝗗𝗮𝘁𝗮
The first risk visible in the report is the possibility that bitcoin-fund outflows could continue. The research confirms only two consecutive negative sessions, so it does not show whether the pattern will extend. Additional negative reports would make the sequence longer, while a return to positive flows would change the immediate picture.
A second risk concerns the session low at $77,770. Bitcoin recovered from that level in the supplied snapshot but remained below its opening price at the end of the period. A later test of the low, or a move below it, would be new information and would need to be assessed when it occurs rather than assumed in advance.
A third risk is overinterpreting the relationship between fund flows and market price. Both negative bitcoin-fund flows and a falling BTCUSDT price appear in the available data, but the research does not establish that the fund flows caused the decline. Treating the reported outflows as the complete explanation would go beyond the evidence.
There is also uncertainty around the reported inflows into ether, XRP, and Solana funds. Those inflows show that the three categories turned positive during the period, but the research does not say whether they represented new capital, reallocations, or temporary positioning. Their significance cannot be measured fully without the amounts and additional days of data.
𝗪𝗵𝗮𝘁 𝗙𝘂𝘁𝘂𝗿𝗲 𝗗𝗮𝘁𝗮 𝗖𝗼𝘂𝗹𝗱 𝗖𝗵𝗮𝗻𝗴𝗲 𝘁𝗵𝗲 𝗣𝗶𝗰𝘁𝘂𝗿𝗲
The next reported bitcoin-fund flows will help show whether the latest two-day outflow is continuing or reversing. The size of any subsequent movement will also matter. A small outflow, a larger outflow, or a return to inflows would each provide a different signal from the current report.
Price behavior around the supplied range will offer another point of comparison. The market’s high was $79,716, while its low was $77,770. Future trading above, within, or below that range would add context to the current decline, but none of those outcomes can be established from the existing data.
The relative performance of the other named fund categories is also relevant. Continued inflows into ether, XRP, and Solana funds alongside bitcoin outflows would preserve the current divergence. If all four categories turned negative, the market picture would look broader than the one described in the latest report. If bitcoin flows improved while the other categories weakened, the reported allocation pattern would change again.
Further market data could also clarify whether the current activity reflects a sustained shift or a short-lived period of volatility. The available snapshot contains price, volume, and trade-count information, but it does not include a longer historical comparison. Additional observations would be needed to place the latest session in a broader context.
𝗔 𝗖𝗮𝘂𝘁𝗶𝗼𝘂𝘀 𝗥𝗲𝗮𝗱𝗶𝗻𝗴 𝗼𝗳 𝘁𝗵𝗲 𝗟𝗮𝘁𝗲𝘀𝘁 𝗗𝗮𝘁𝗮
The latest information presents a focused but limited warning for bitcoin’s near-term market conditions. Bitcoin funds recorded a second straight day of outflows, with Wednesday’s reported $120 million exit exceeding Tuesday’s loss. At the same time, ether, XRP, and Solana funds recorded inflows, producing a divided flow picture rather than a uniform move across the reported categories.
Bitcoin’s market performance was also weaker during the supplied measurement period. BTCUSDT opened near $79,698, reached a high of $79,716, fell to $77,770, and ended at $78,110.01. The price declined 1.993% over the period, while the weighted average price was $78,650.23. Trading activity exceeded 13,763 BTC in volume and approximately $1.082 billion in quote volume.
Taken together, the figures show short-term pressure and active repositioning, but they do not prove that a lasting downtrend has begun. The evidence supports a more measured conclusion: bitcoin demand was weaker during the observed period, while interest in the other named fund categories remained positive. Further flow reports and additional price data are necessary to determine whether the latest divergence is temporary or develops into a more persistent market pattern.
251
·
--
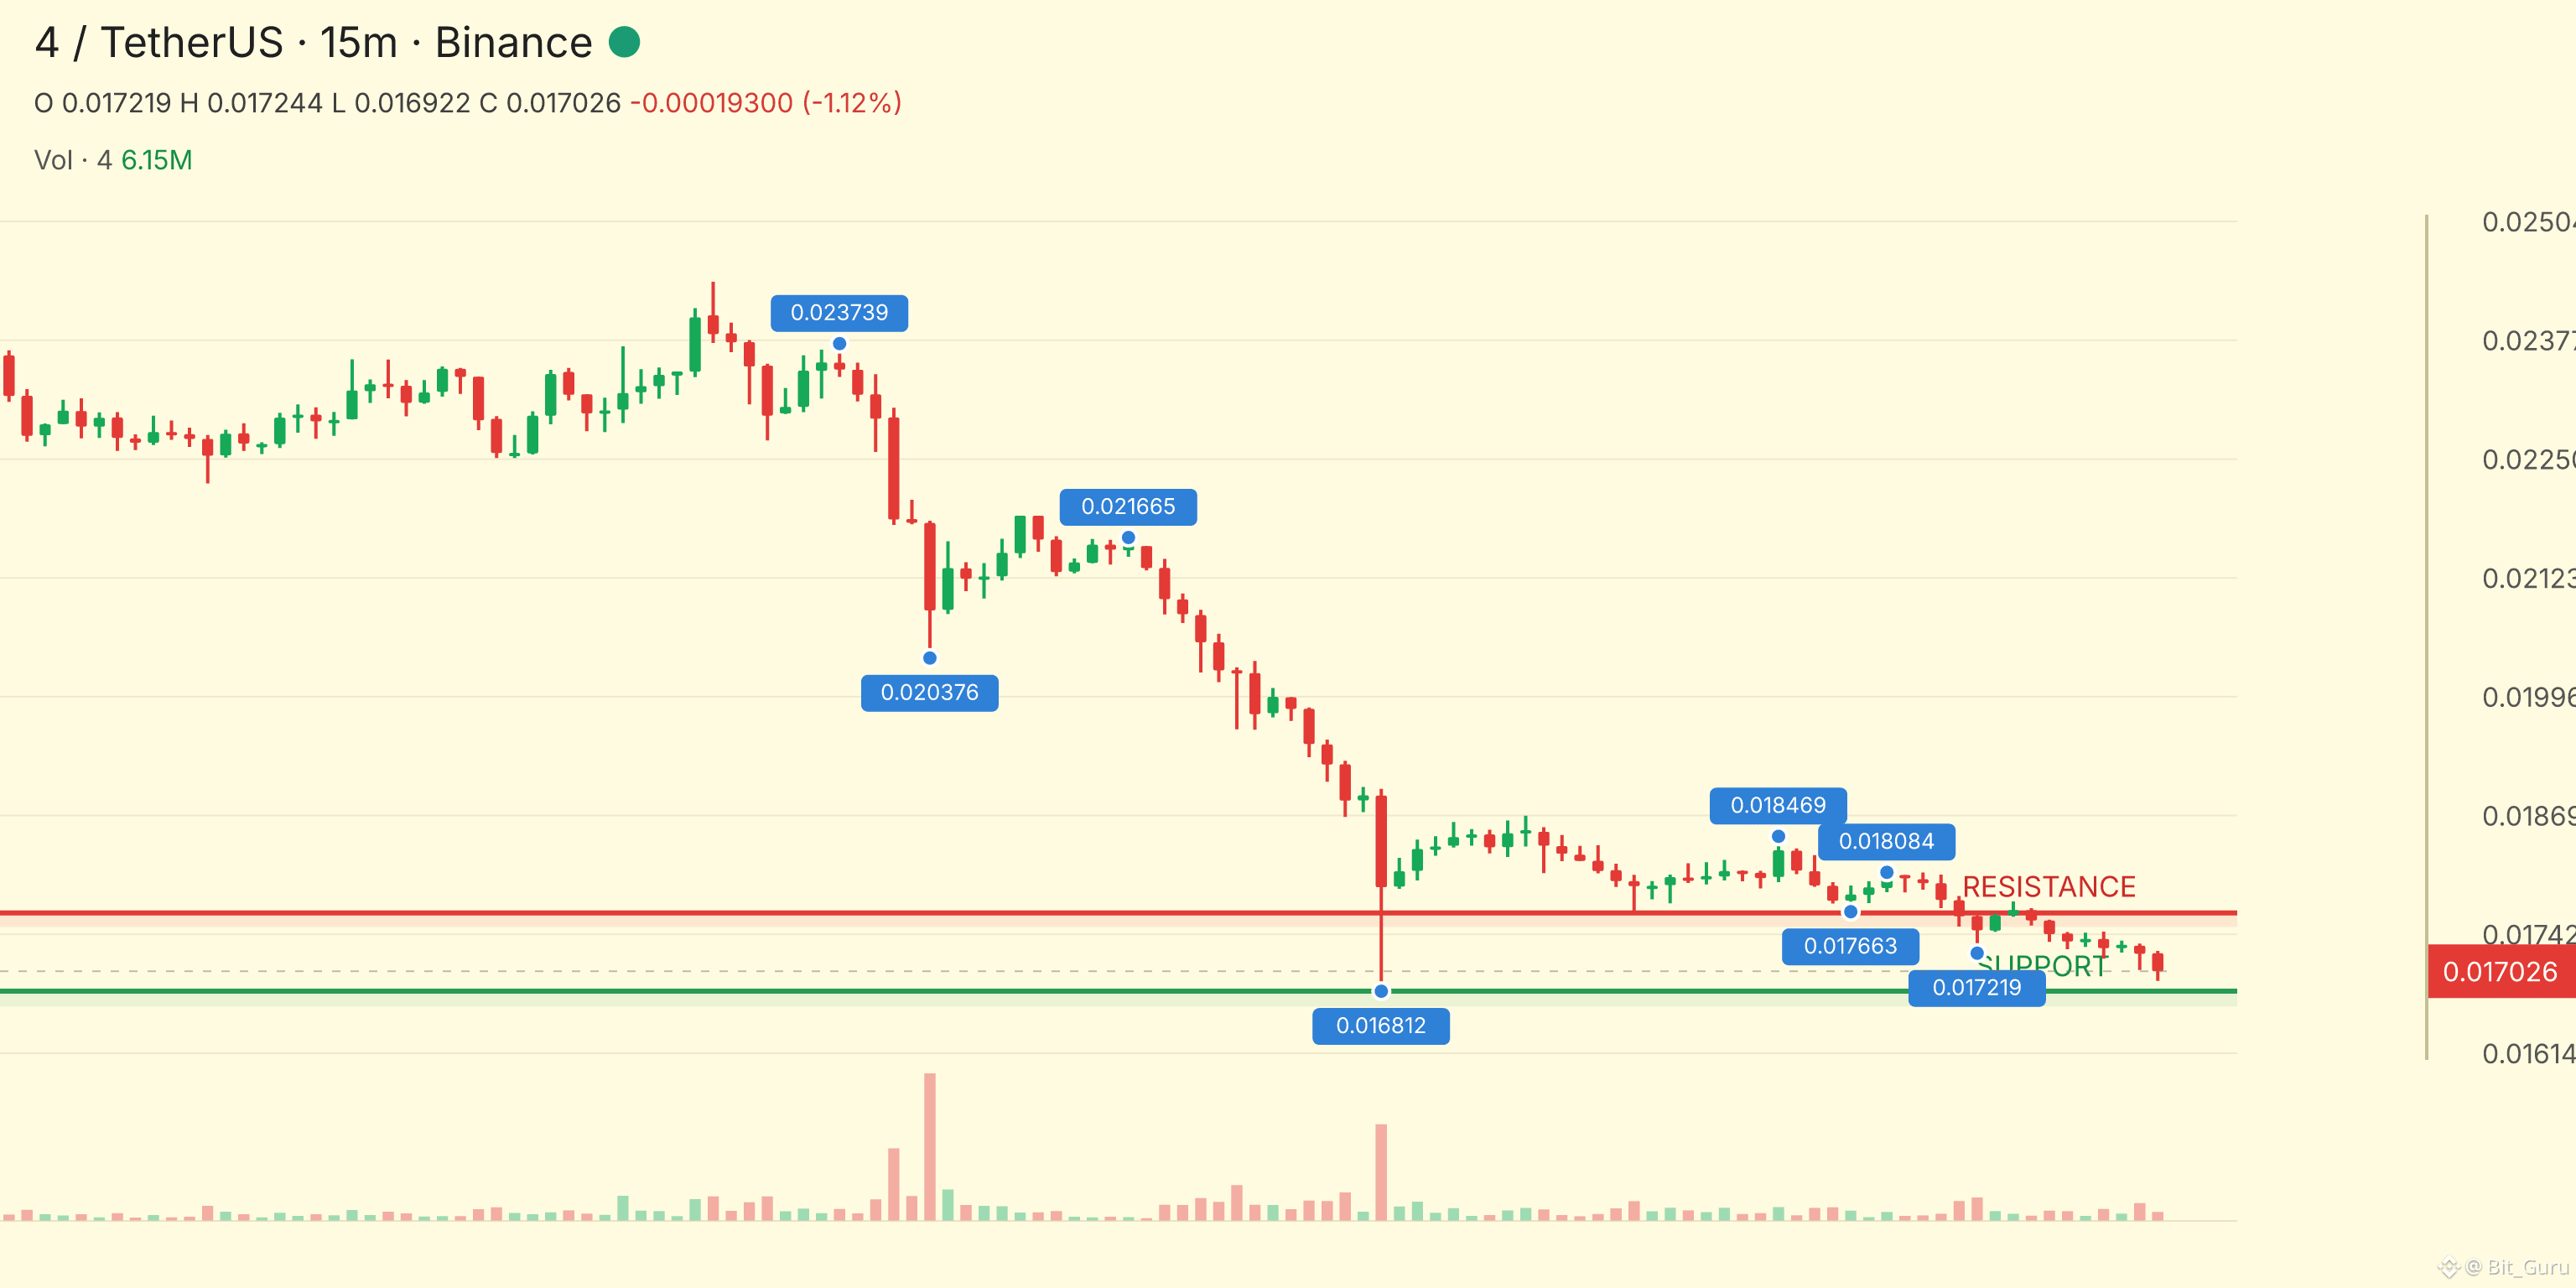
This Chart Deserves A Look...!! $4 is going DOWN...!!
ENTRY: 0.016986 - 0.016995
TP1: 0.016849
TP2: 0.016787
TP3: 0.016726...
This Chart Deserves A Look...!! $4 is going DOWN...!!
ENTRY: 0.016986 - 0.016995
TP1: 0.016849
TP2: 0.016787
TP3: 0.016726...
ENTRY: 0.016986 - 0.016995
TP1: 0.016849
TP2: 0.016787
TP3: 0.016726...
300
·
--
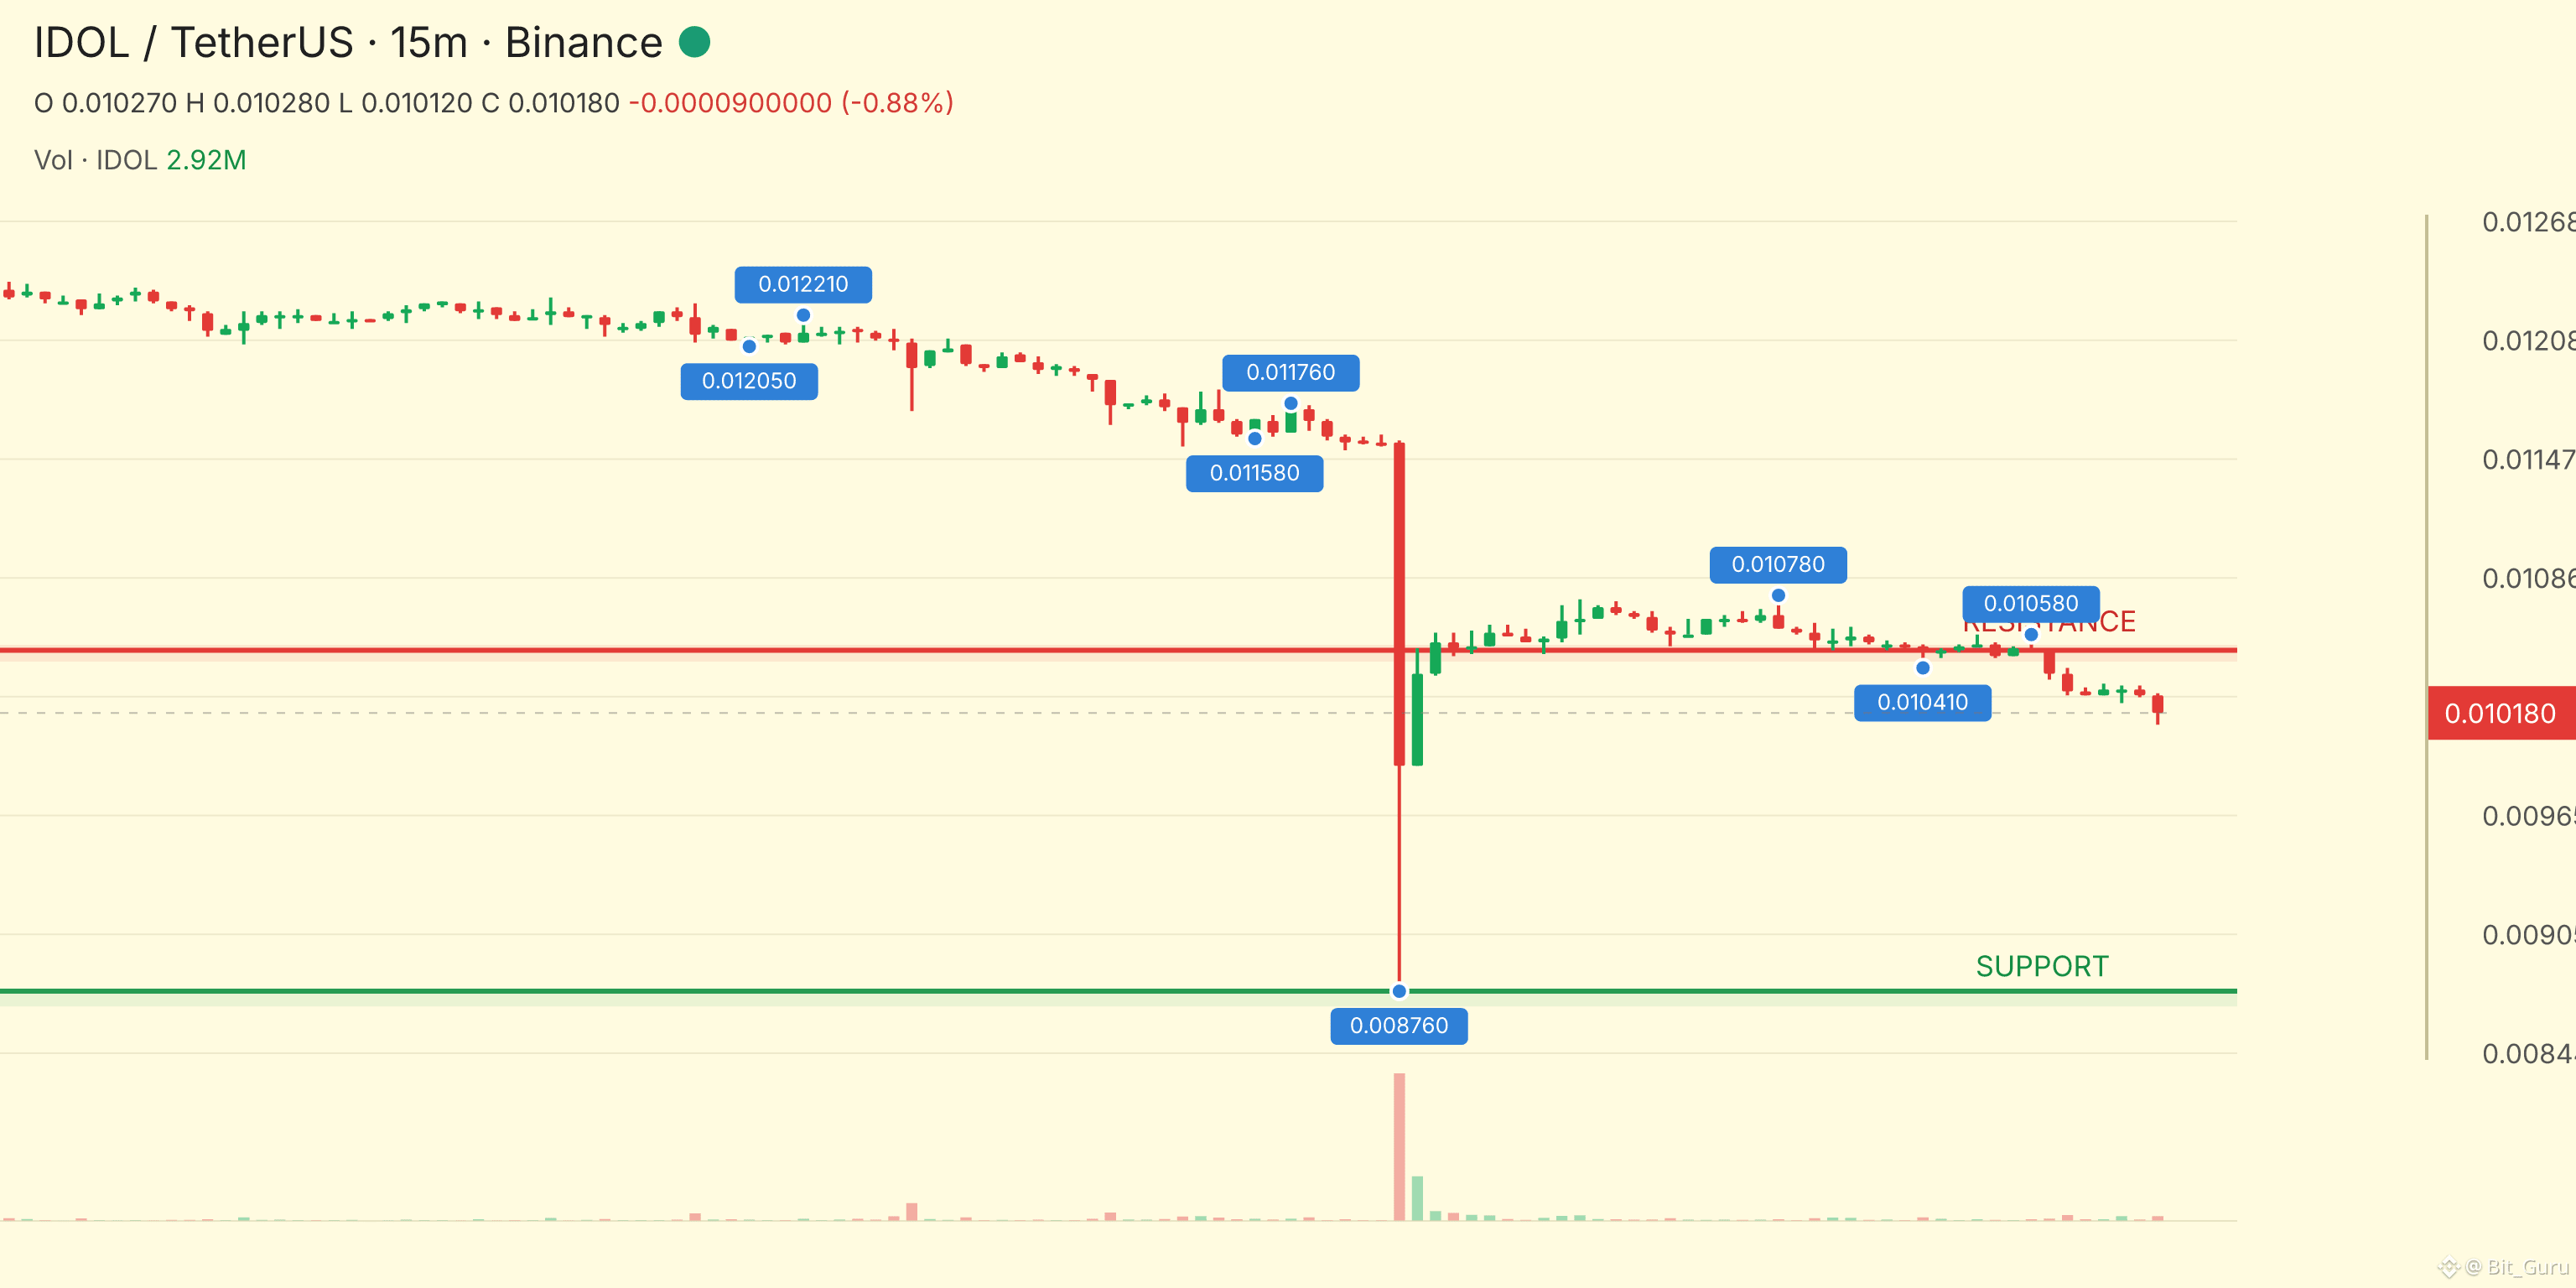
Watch This Move...!! $IDOL is going DOWN...!!
ENTRY: 0.010165 - 0.01017
TP1: 0.010082
TP2: 0.010046
TP3: 0.010009...
Watch This Move...!! $IDOL is going DOWN...!!
ENTRY: 0.010165 - 0.01017
TP1: 0.010082
TP2: 0.010046
TP3: 0.010009...
ENTRY: 0.010165 - 0.01017
TP1: 0.010082
TP2: 0.010046
TP3: 0.010009...
256
·
--
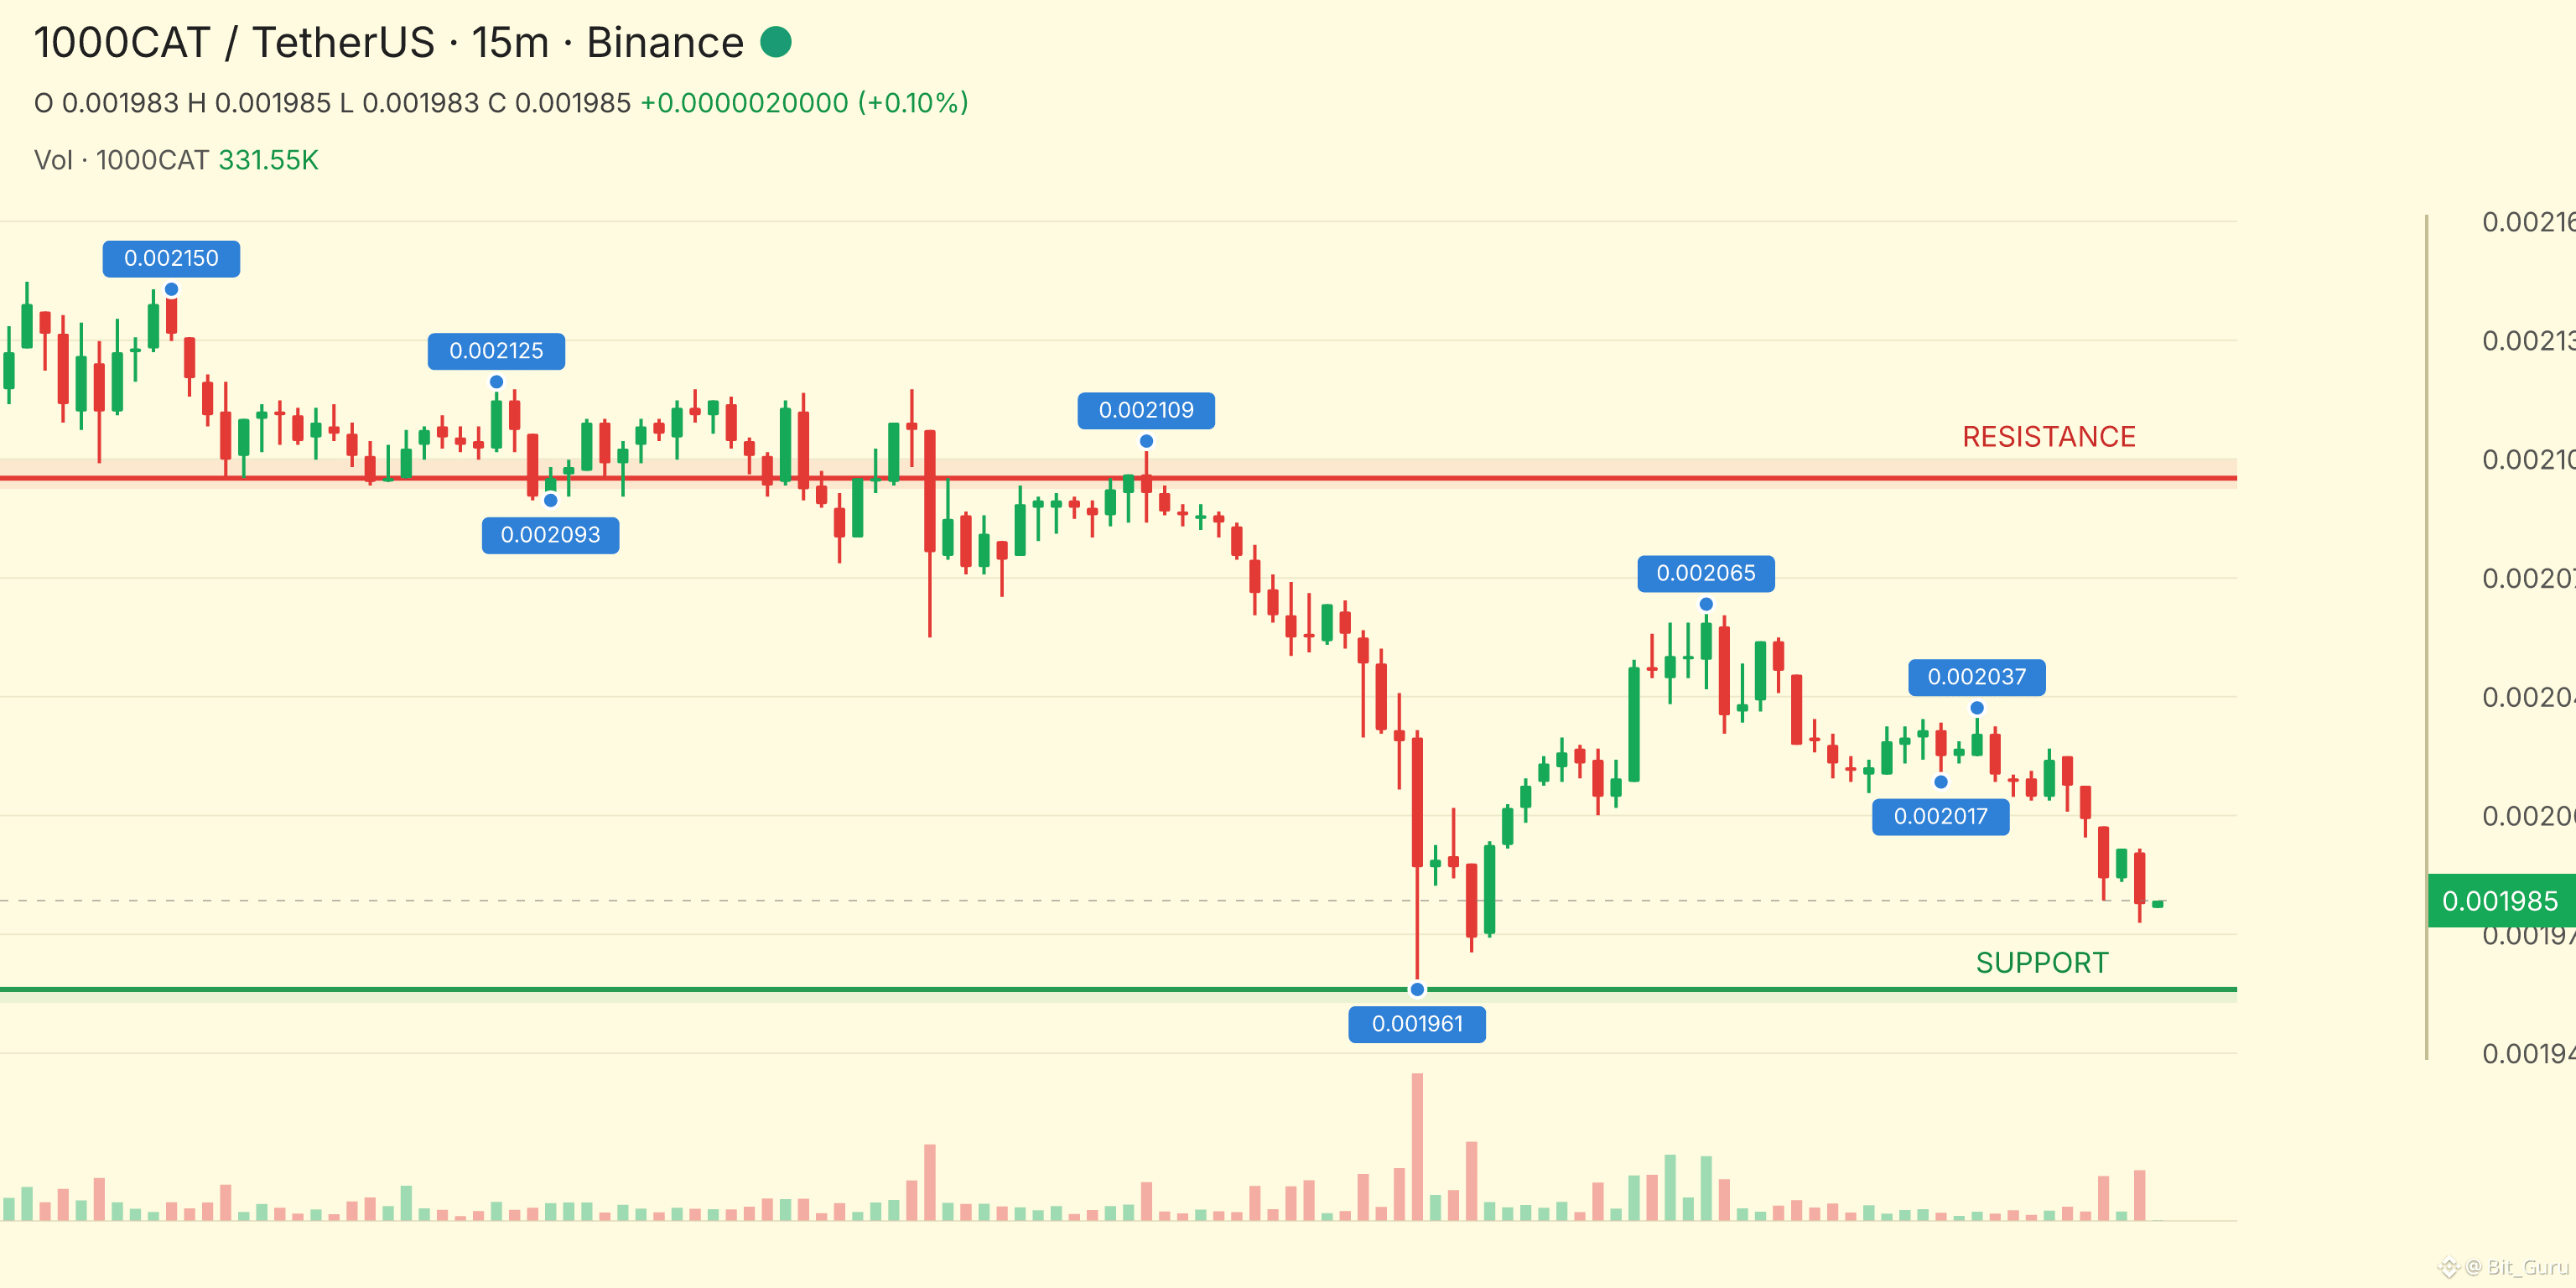
A Strong Setup Is Forming...!! $1000CAT is going DOWN...!!
ENTRY: 0.00198102 - 0.00198202
TP1: 0.00196559
TP2: 0.00195868
TP3: 0.00195178...
A Strong Setup Is Forming...!! $1000CAT is going DOWN...!!
ENTRY: 0.00198102 - 0.00198202
TP1: 0.00196559
TP2: 0.00195868
TP3: 0.00195178...
ENTRY: 0.00198102 - 0.00198202
TP1: 0.00196559
TP2: 0.00195868
TP3: 0.00195178...
269
·
--
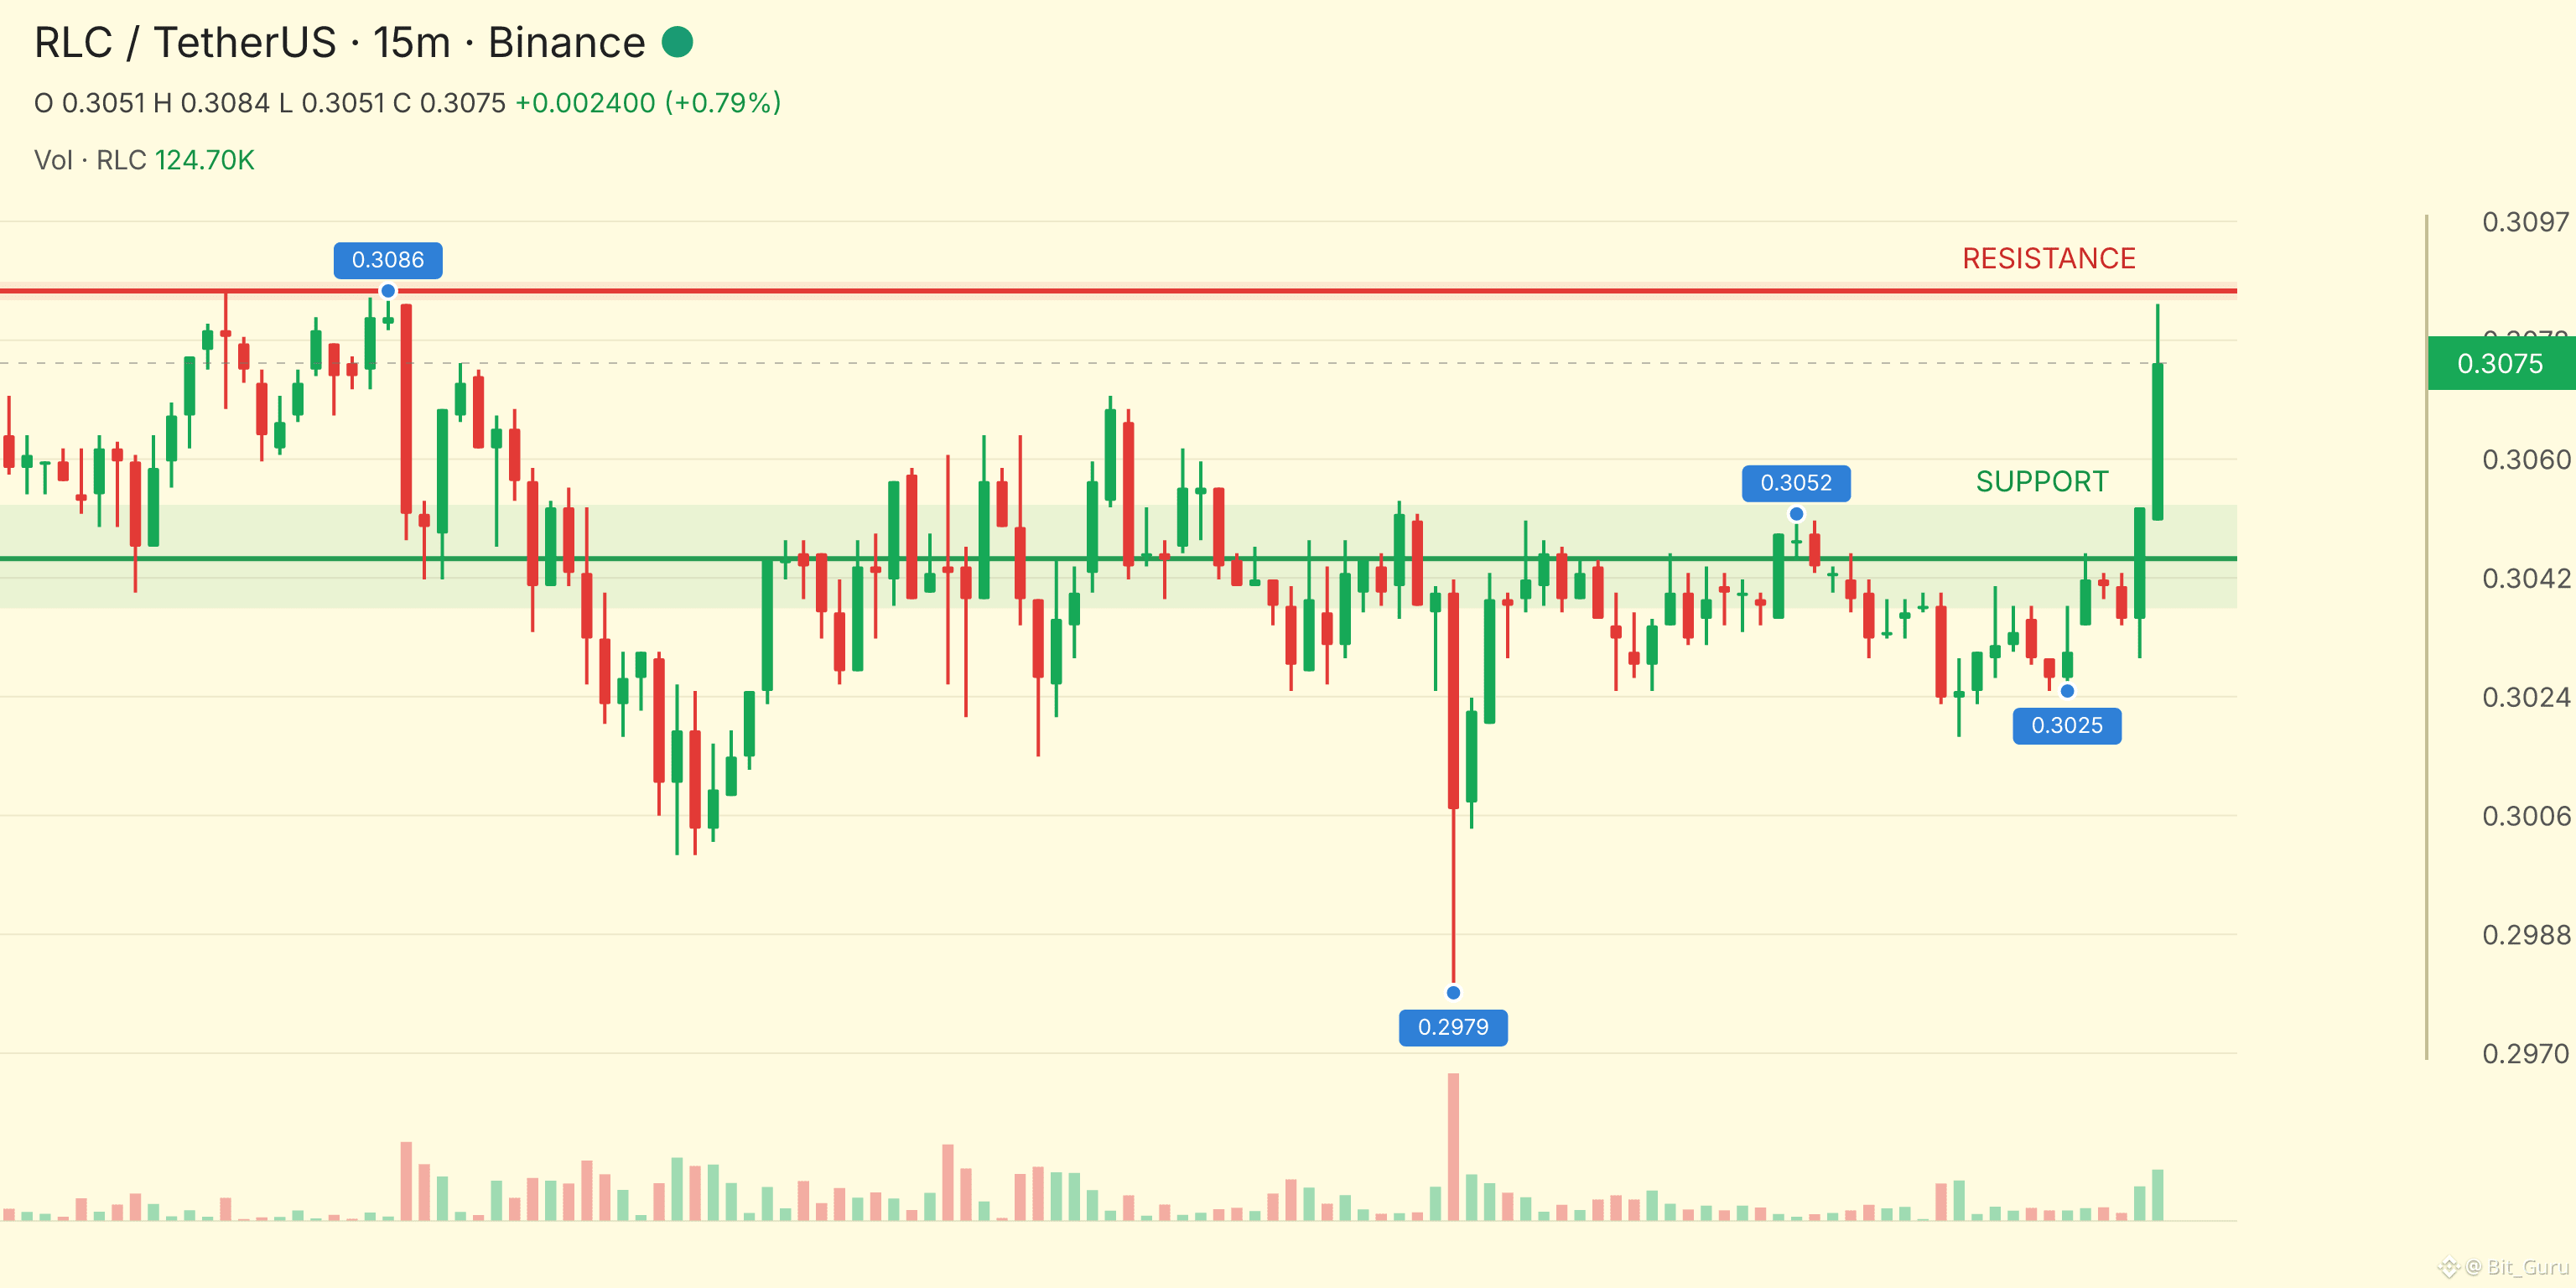
This Coin Is Ready To Move...!! $RLC is going UP...!!
ENTRY: 0.30704 - 0.30735
TP1: 0.30926
TP2: 0.30992
TP3: 0.31058...
This Coin Is Ready To Move...!! $RLC is going UP...!!
ENTRY: 0.30704 - 0.30735
TP1: 0.30926
TP2: 0.30992
TP3: 0.31058...
ENTRY: 0.30704 - 0.30735
TP1: 0.30926
TP2: 0.30992
TP3: 0.31058...
290
·
--
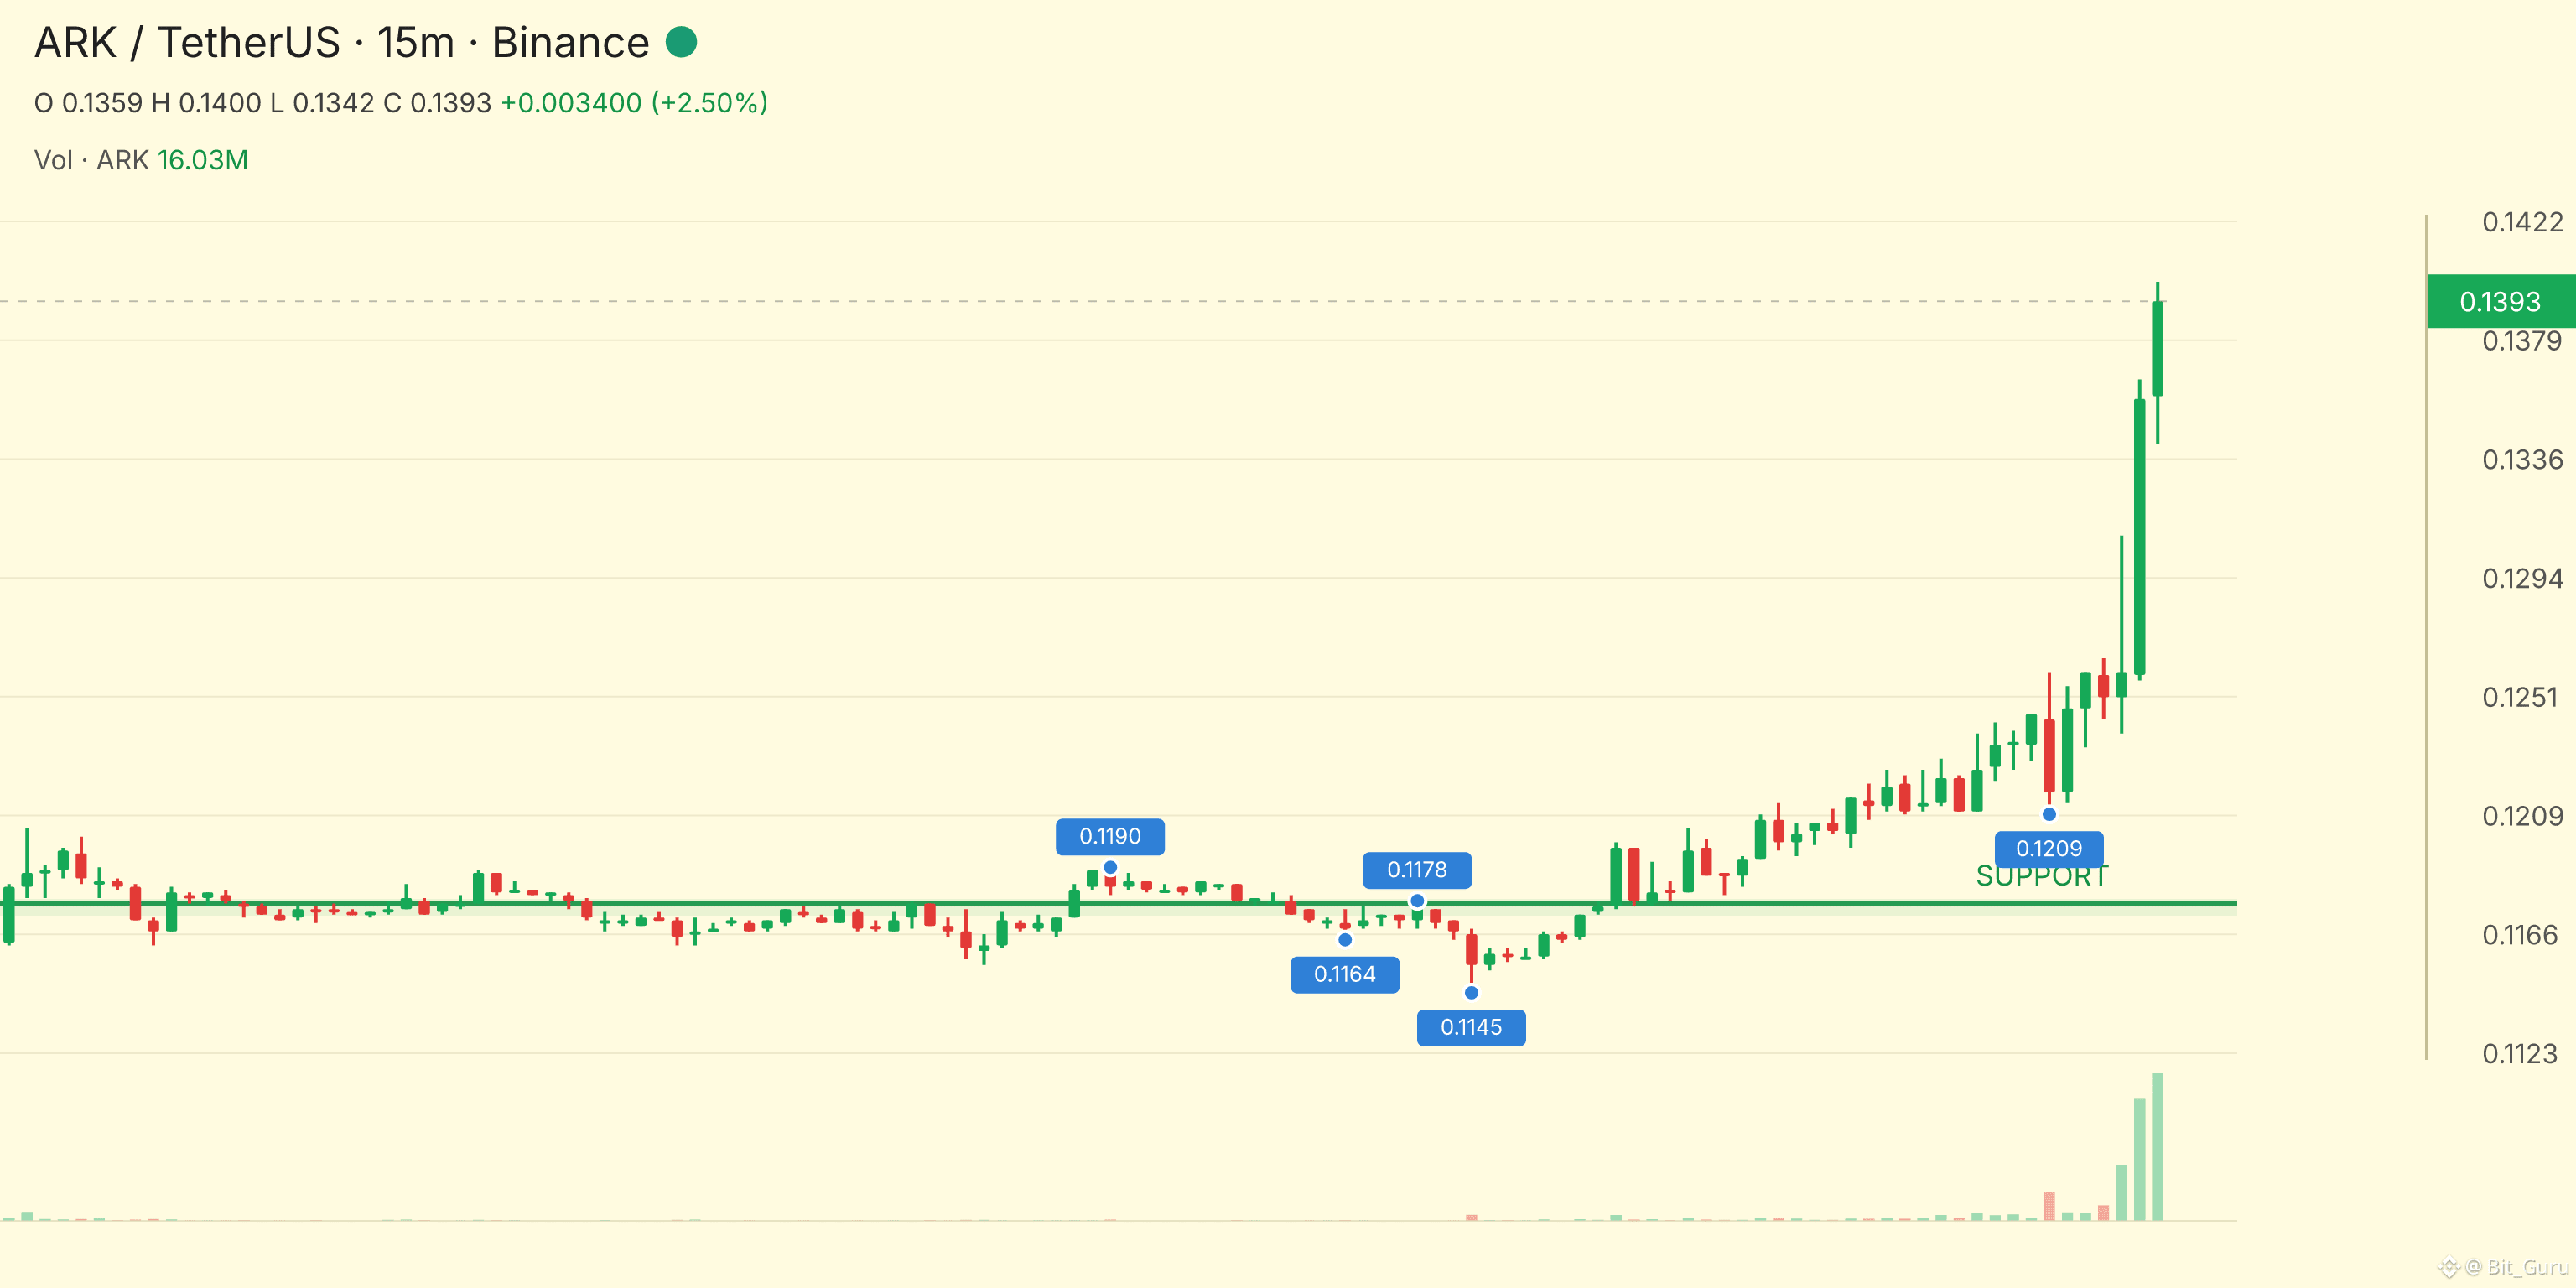
Momentum Is Showing Up...!! $ARK is going UP...!!
ENTRY: 0.13899 - 0.13913
TP1: 0.14054
TP2: 0.14104
TP3: 0.14154...
Momentum Is Showing Up...!! $ARK is going UP...!!
ENTRY: 0.13899 - 0.13913
TP1: 0.14054
TP2: 0.14104
TP3: 0.14154...
ENTRY: 0.13899 - 0.13913
TP1: 0.14054
TP2: 0.14104
TP3: 0.14154...
2
470
·
--
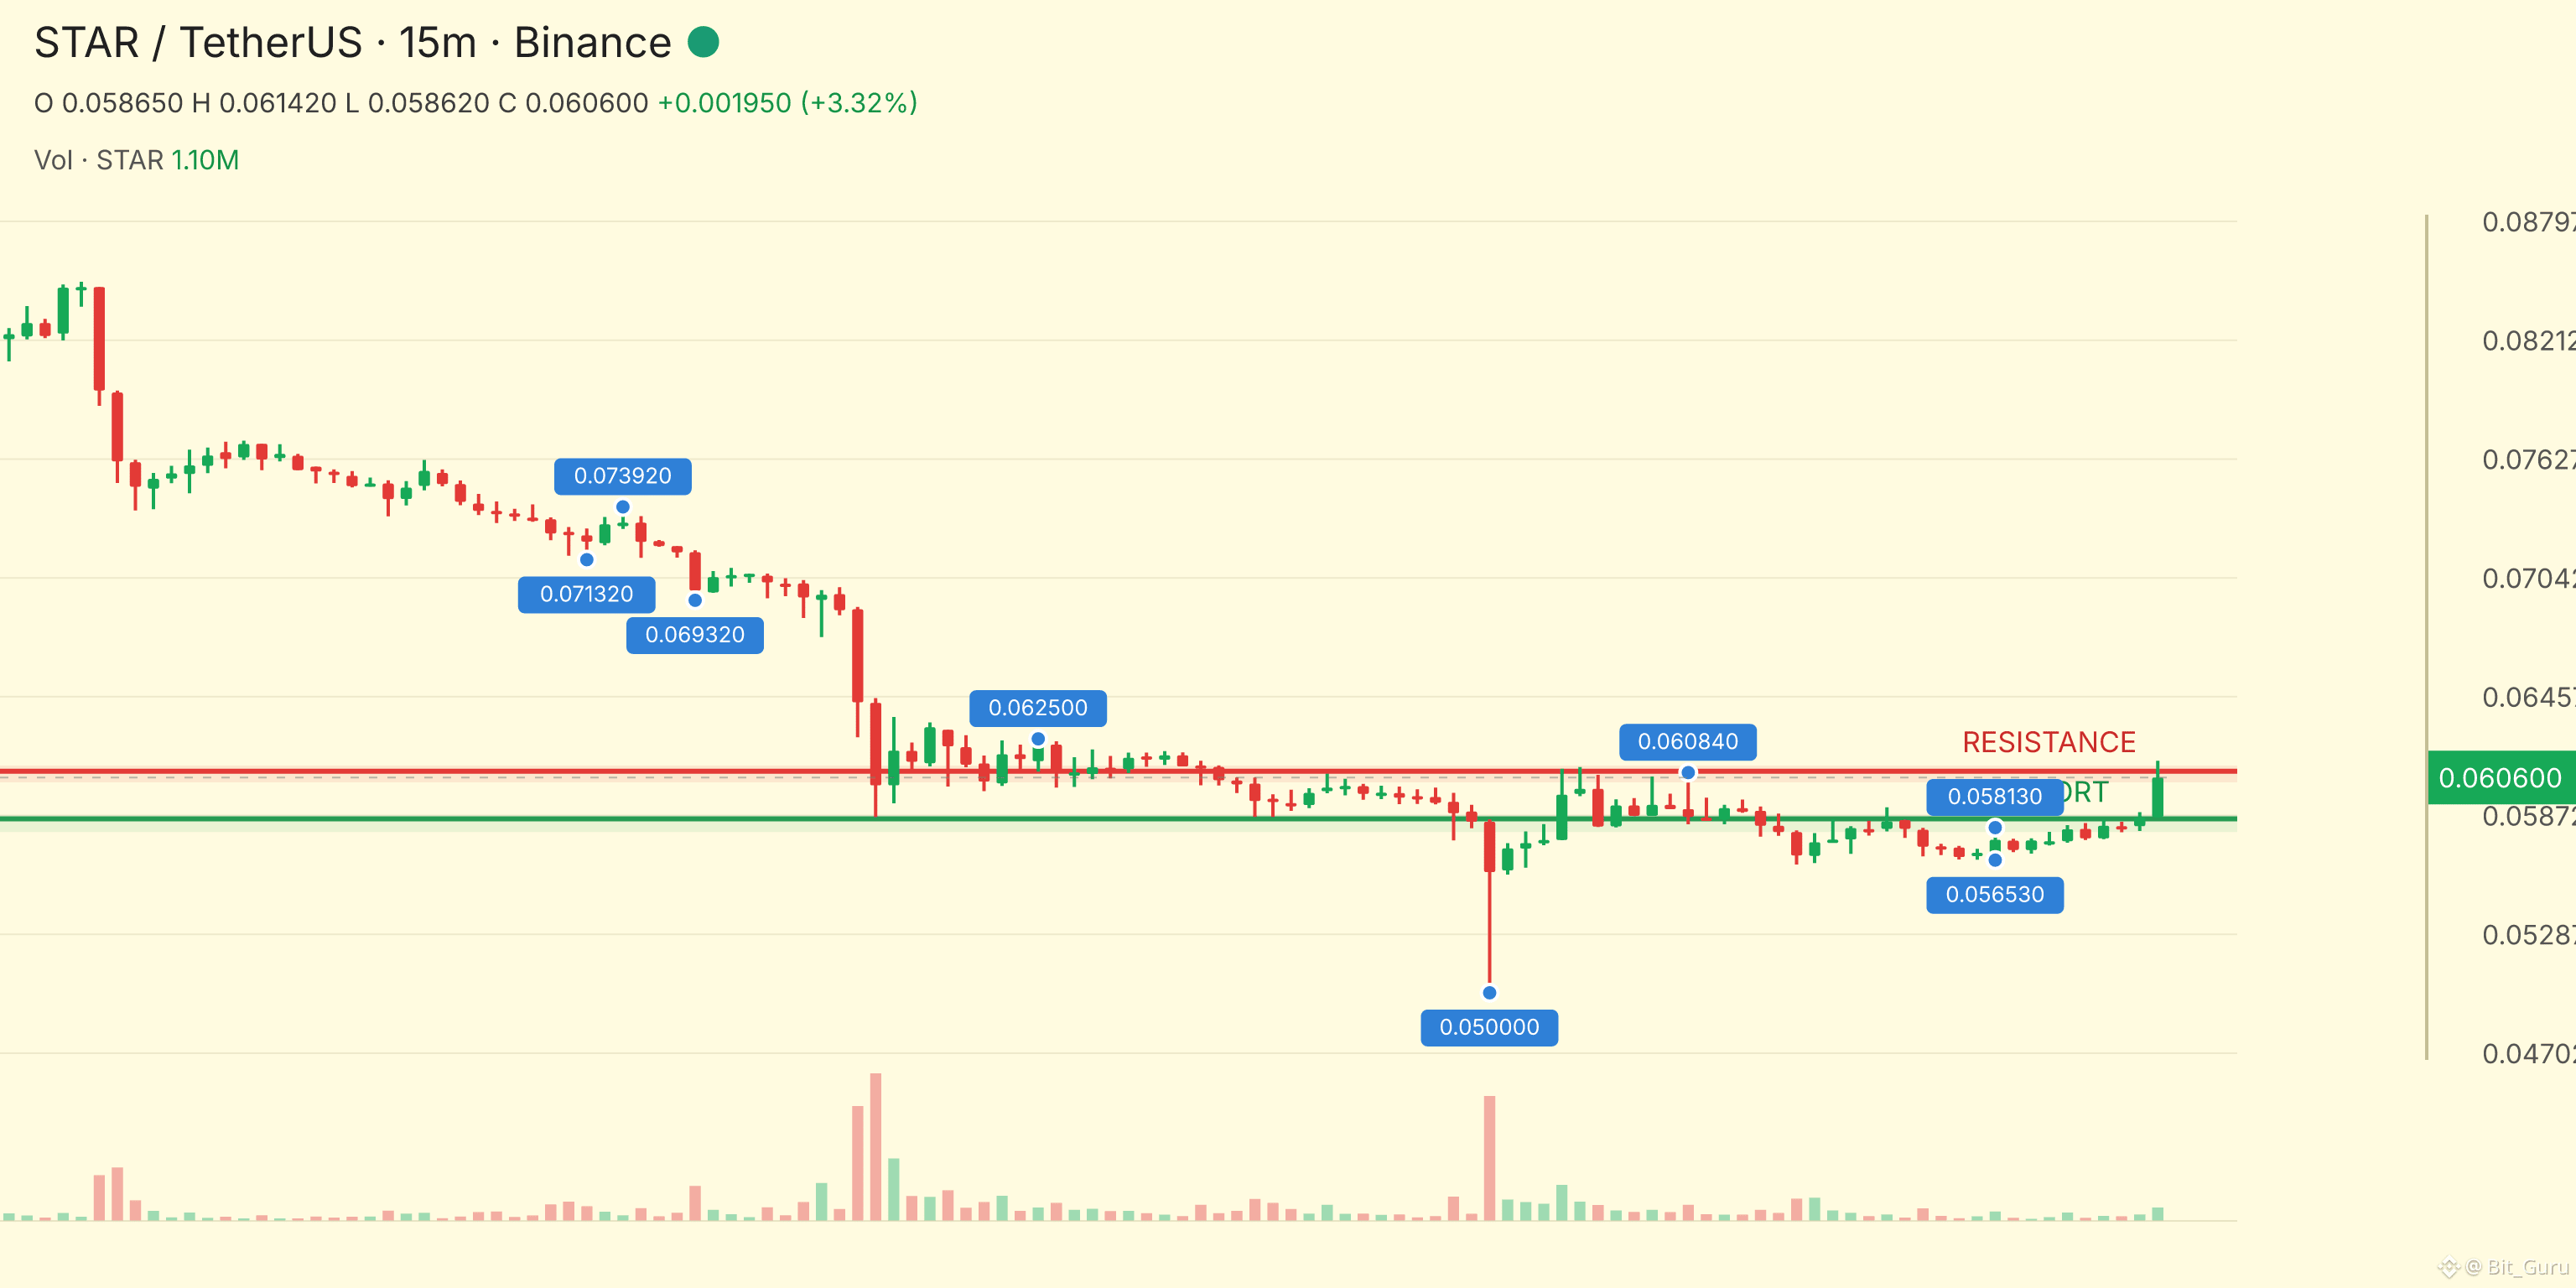
The Chart Is Looking Strong...!! $STAR is going UP...!!
ENTRY: 0.060509 - 0.06057
TP1: 0.061182
TP2: 0.0614
TP3: 0.061618...
The Chart Is Looking Strong...!! $STAR is going UP...!!
ENTRY: 0.060509 - 0.06057
TP1: 0.061182
TP2: 0.0614
TP3: 0.061618...
ENTRY: 0.060509 - 0.06057
TP1: 0.061182
TP2: 0.0614
TP3: 0.061618...
344
·
--
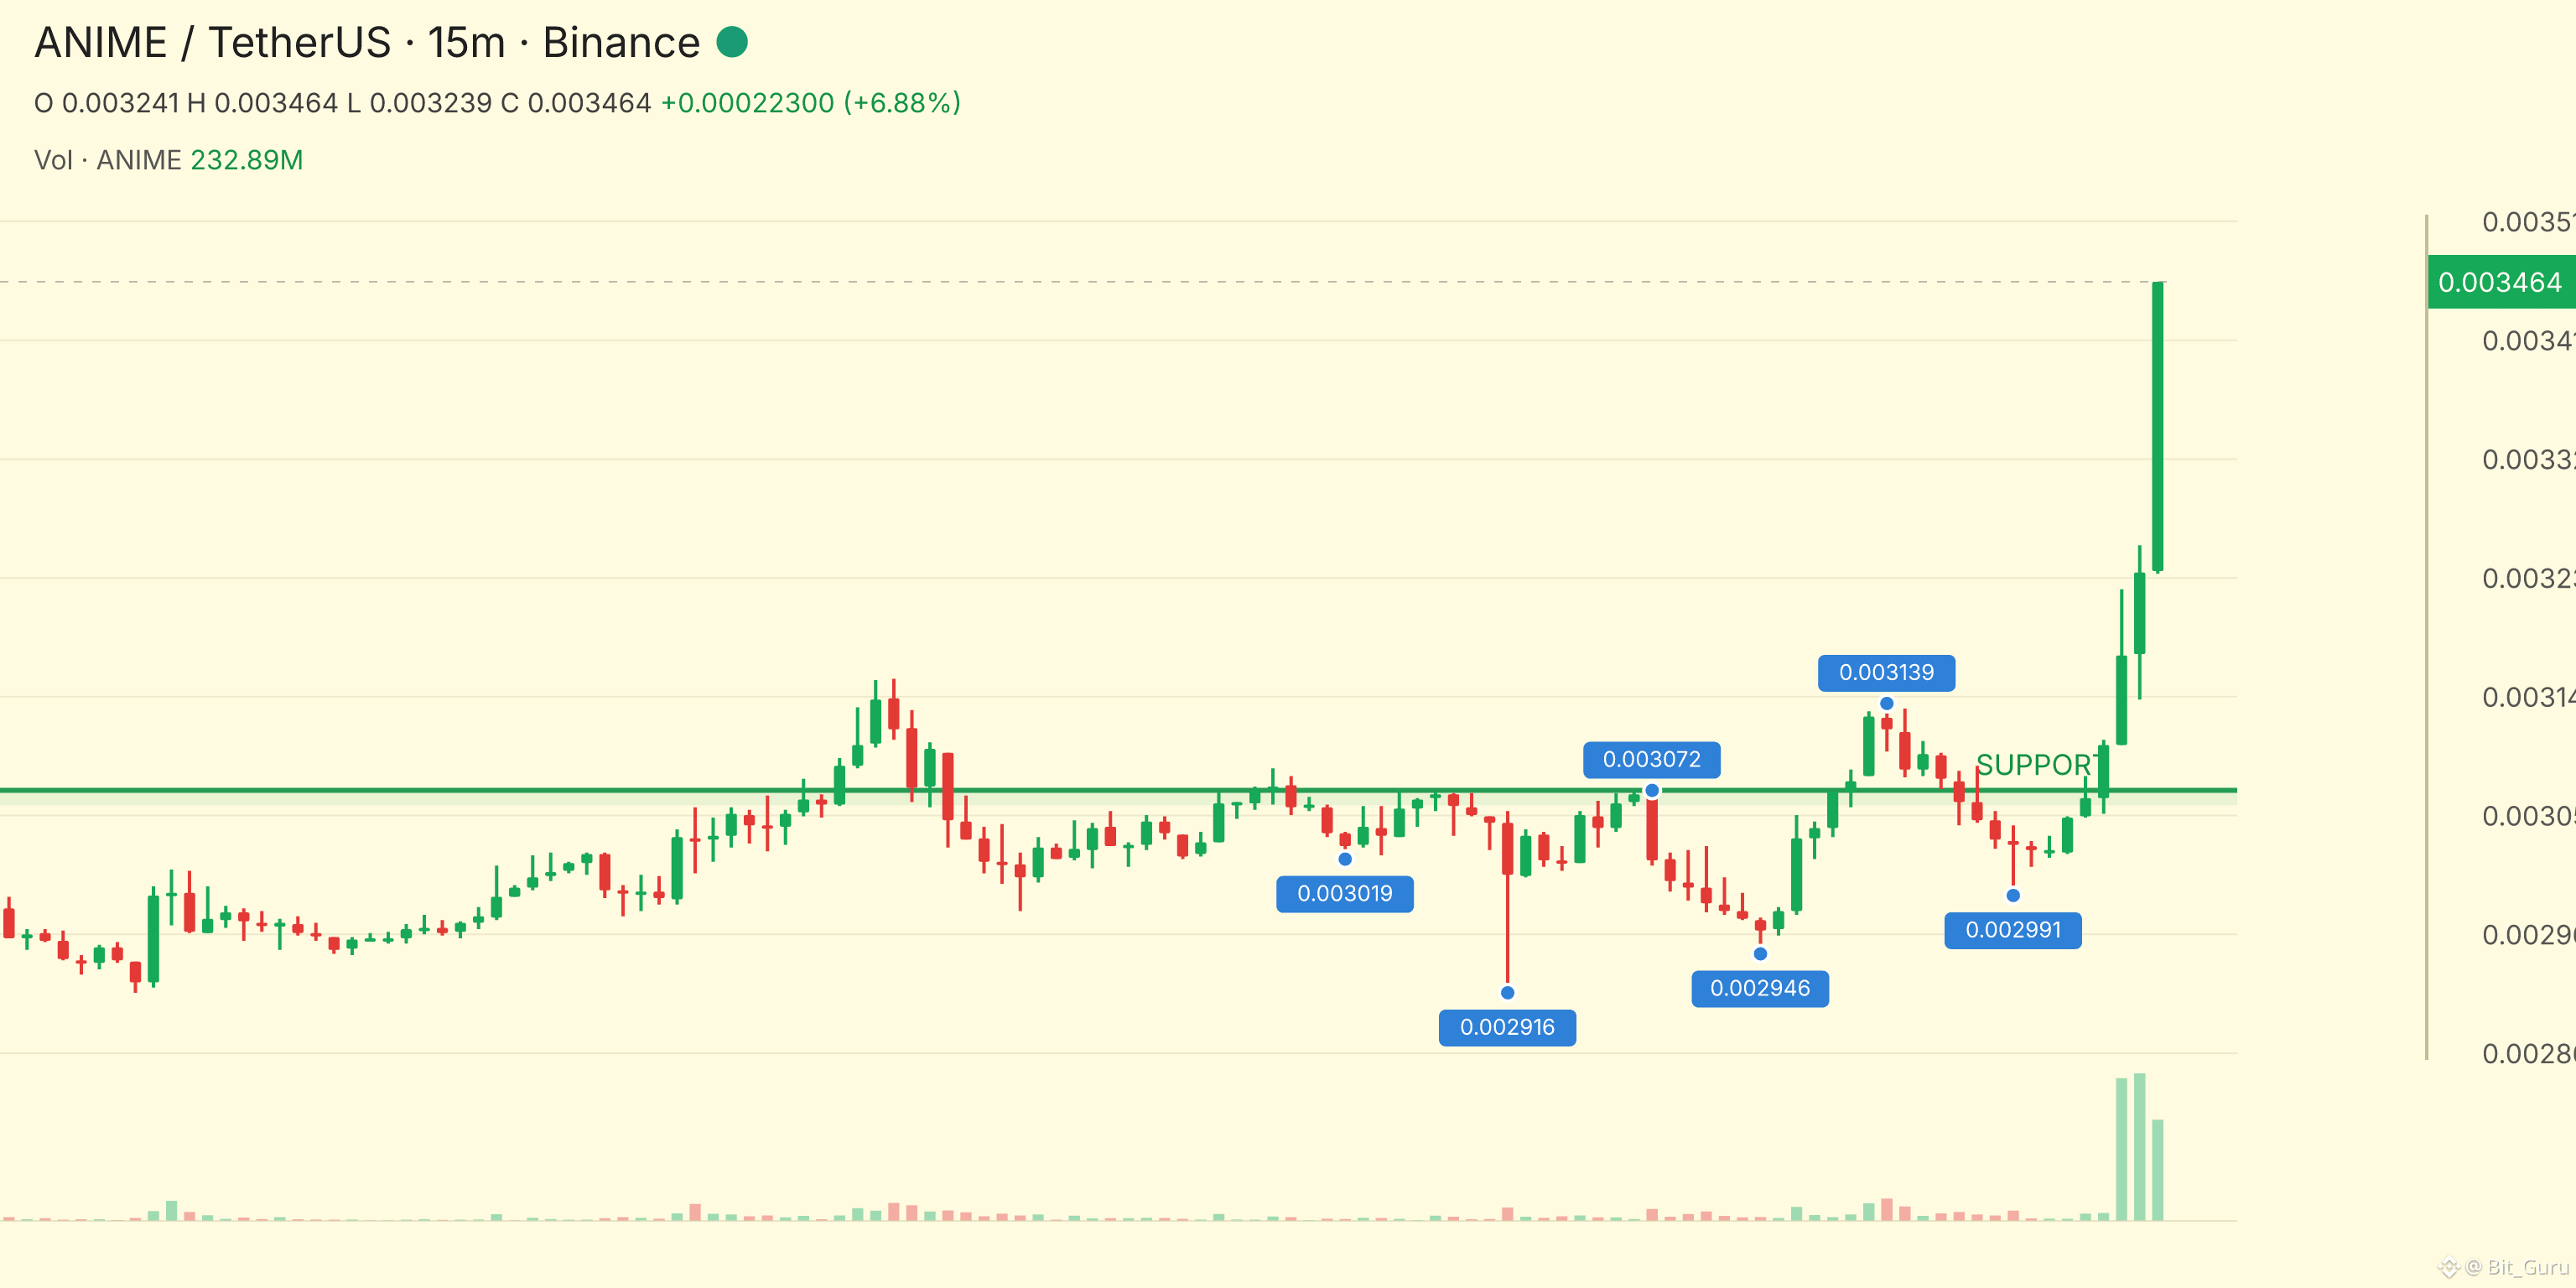
The Chart Is Looking Strong...!! $ANIME is going UP...!!
ENTRY: 0.00343983 - 0.00344328
TP1: 0.00347807
TP2: 0.00349047
TP3: 0.00350288...
The Chart Is Looking Strong...!! $ANIME is going UP...!!
ENTRY: 0.00343983 - 0.00344328
TP1: 0.00347807
TP2: 0.00349047
TP3: 0.00350288...
ENTRY: 0.00343983 - 0.00344328
TP1: 0.00347807
TP2: 0.00349047
TP3: 0.00350288...
344
Log in to explore more content
Join global crypto users on Binance Square
⚡️ Get latest and useful information about crypto.
💬 Trusted by the world’s largest crypto exchange.
👍 Discover real insights from verified creators.
Email / Phone number
Trending Topics
AppleDebutsFoldablePhone
42,105 views
839 Discussing
Apple just dropped the foldable iPhone — and the market is paying attention. This isn't just another product cycle; it's a new product category, a new CEO on stage, and a $1,999 price tag that pushes $AAPL further into ultra-premium territory. Foldables are the narrative, and Apple is now the headline.
#appledebutsfoldablephone #EUExtendsCentralContactPointToCASPs #US10YTreasuryYieldHitsHighestSinceNov2023 #BrentCrudeTops$100 #USTreasuryToBuyBackUpTo$6BLongDatedDebt
KimHotbae
·2 Likes
·2.9k views
TSMCAugustRevenueUp53.3%YoY
9,198 views
266 Discussing
IranSaysReadyToEscalateWarWithUS
11,441 views
269 Discussing