
Abo-Khalid-Dobal
10.1k Posts

Abo-Khalid-Dobal
Report
Block User
2.2K+ Following
519 Followers
1.1K+ Liked
Posts
All
Quotes
·
--
Bullish
As we expected earlier.
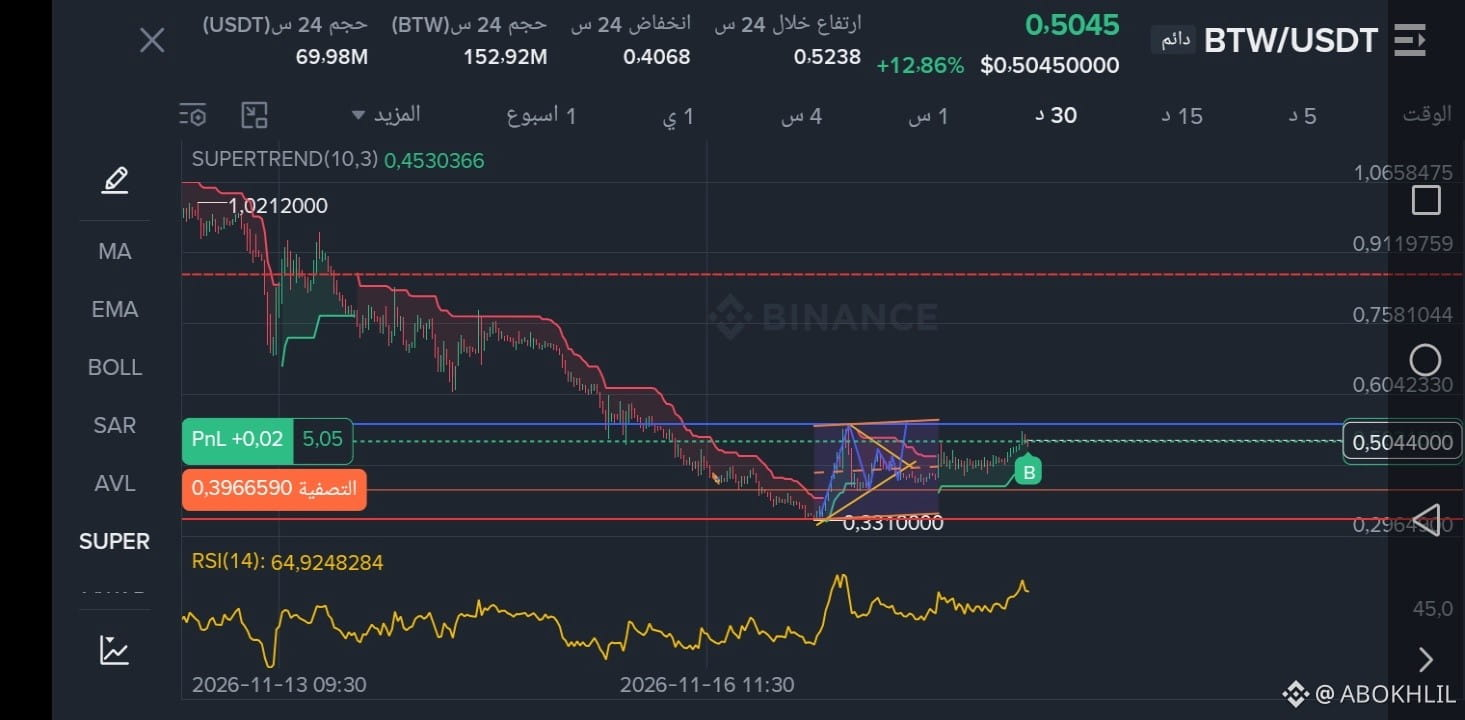
🔥 $BTW
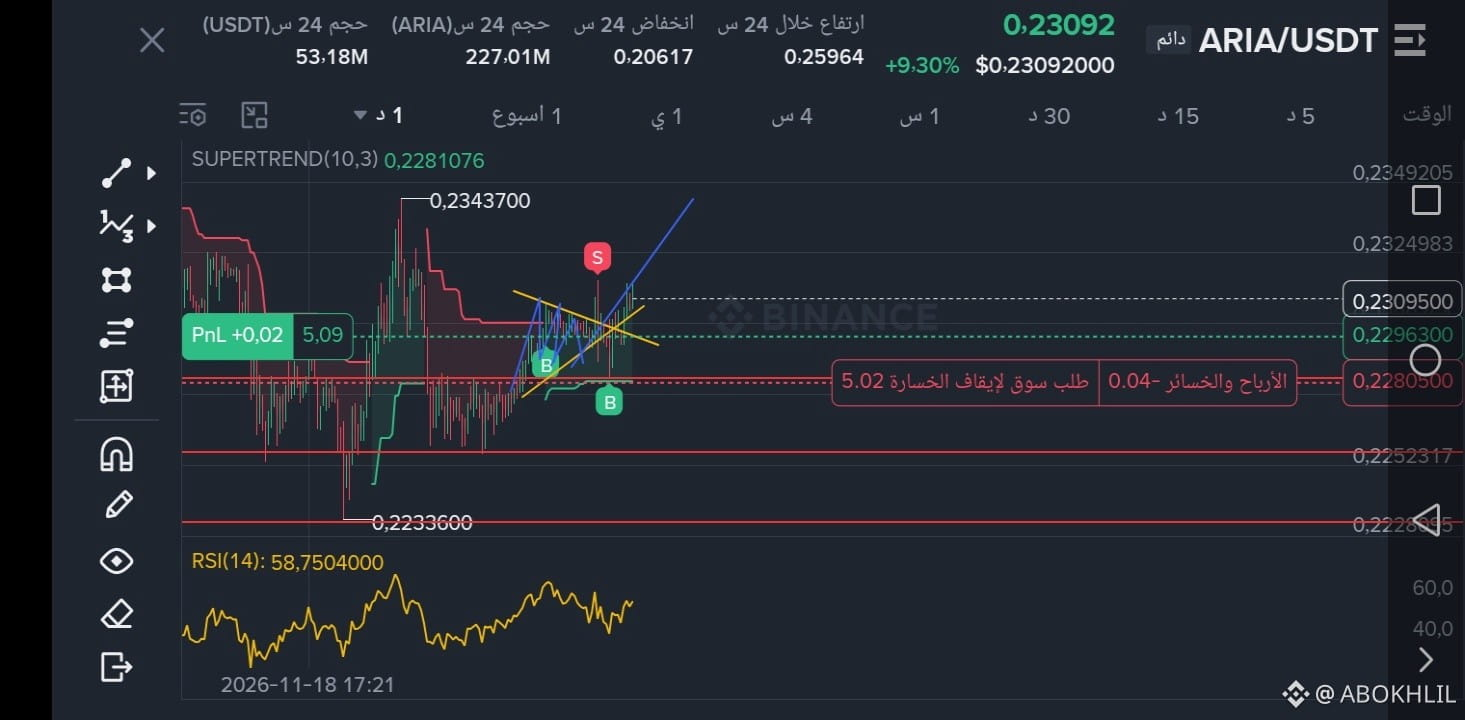
ARIA: Both are rising
$BTW: 0.5045$ | +12.86%
SuperTrend: 0.4530$ 🟢
RSI: 64.92
Support: 0.4530$ | Resistance: 0.5238$
$ARIA: 0.23092$ | +9.30%
SuperTrend: 0.22810$ 🟢
RSI: 58.75
Support: 0.22810$ | Resistance: 0.23437$
Both above SuperTrend = bullish trend!
Holding above support = they keep rising
Breaking support = correction
#ARIA
$ARIA
#BTW
#ARIA #Crypto
#Binance
Just analysis
As we expected earlier.
🔥 $BTW
ARIA: Both are rising
$BTW : 0.5045$ | +12.86%
SuperTrend: 0.4530$ 🟢
RSI: 64.92
Support: 0.4530$ | Resistance: 0.5238$
$ARIA : 0.23092$ | +9.30%
SuperTrend: 0.22810$ 🟢
RSI: 58.75
Support: 0.22810$ | Resistance: 0.23437$
Both above SuperTrend = bullish trend!
Holding above support = they keep rising
Breaking support = correction
#ARIA
$ARIA
#BTW
#ARIA #Crypto
#Binance
Just analysis
🔥 $BTW
ARIA: Both are rising
$BTW : 0.5045$ | +12.86%
SuperTrend: 0.4530$ 🟢
RSI: 64.92
Support: 0.4530$ | Resistance: 0.5238$
$ARIA : 0.23092$ | +9.30%
SuperTrend: 0.22810$ 🟢
RSI: 58.75
Support: 0.22810$ | Resistance: 0.23437$
Both above SuperTrend = bullish trend!
Holding above support = they keep rising
Breaking support = correction
#ARIA
$ARIA
#BTW
#ARIA #Crypto
#Binance
Just analysis
1
48
·
--
Bullish
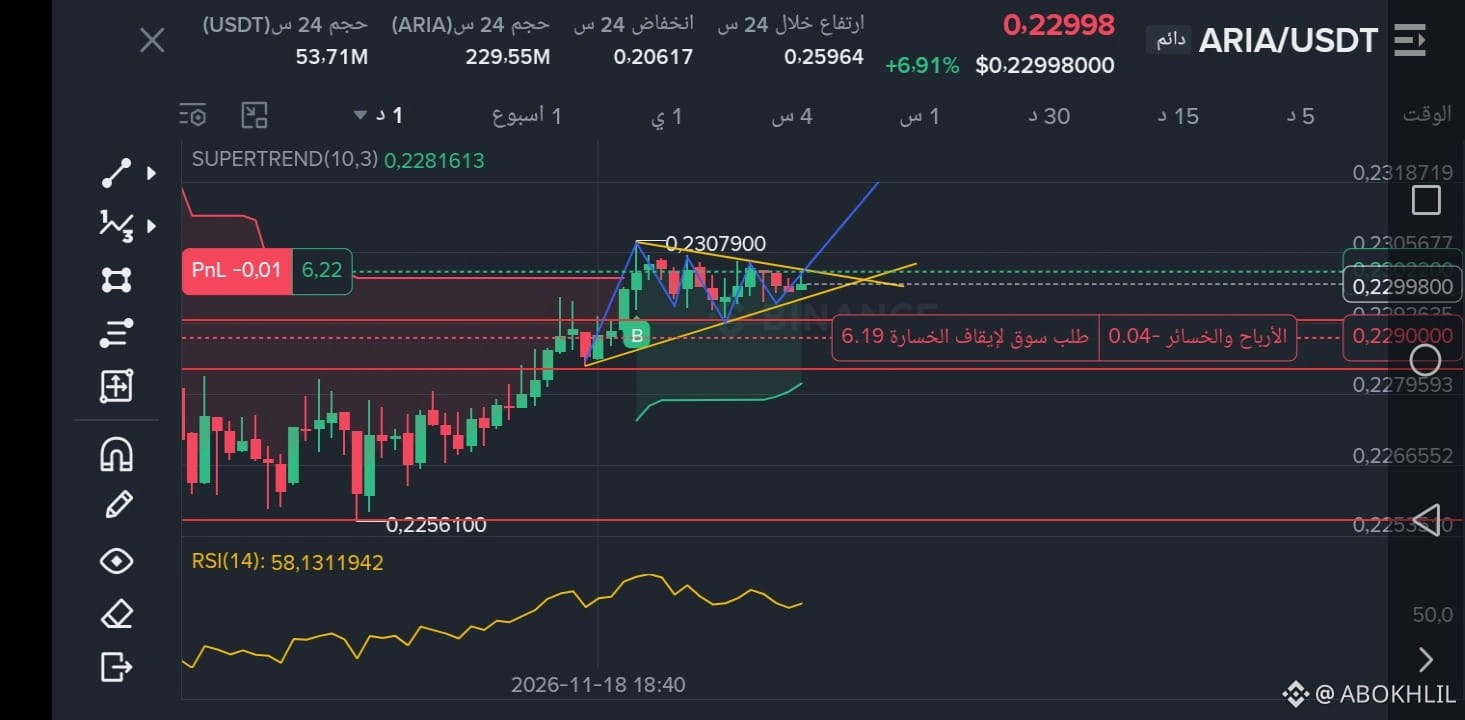
$ARIA Narrow Triangle - Breakout Imminent
Price now: $0.22998
24h change: +6.91%
24h high: $0.25964
24h low: $0.20617
Trading volume: $53.71M
After surging from $0.20617 to $0.25964 = +25.93%, $ARIA has started to squeeze inside a triangle!
📊 SuperTrend: $0.22816, green = trend is still bullish
Price is only +0.79% above it!
📊 RSI: 58.13 = above 50 = strong buying momentum
📊 Price: inside a narrow ascending triangle, with only 0.78% between the top and bottom
Resistance:
1. $0.23079 = triangle ceiling - breakout = surge
2. $0.25964 = 24h high
Support:
1. $0.22900 = triangle floor - breaking below it = correction
2. $0.22561
Break above $0.23079 = heads to $0.25964
Break below $0.22900 = heads to $0.22561
Will $ARIA surge upward or break downward?
Hopefully upward. This is just analysis.
#ARIA
#Crypto #Binance
#ARIAUSDT
$ARIA Narrow Triangle - Breakout Imminent
Price now: $0.22998
24h change: +6.91%
24h high: $0.25964
24h low: $0.20617
Trading volume: $53.71M
After surging from $0.20617 to $0.25964 = +25.93%, $ARIA has started to squeeze inside a triangle!
📊 SuperTrend: $0.22816, green = trend is still bullish
Price is only +0.79% above it!
📊 RSI: 58.13 = above 50 = strong buying momentum
📊 Price: inside a narrow ascending triangle, with only 0.78% between the top and bottom
Resistance:
1. $0.23079 = triangle ceiling - breakout = surge
2. $0.25964 = 24h high
Support:
1. $0.22900 = triangle floor - breaking below it = correction
2. $0.22561
Break above $0.23079 = heads to $0.25964
Break below $0.22900 = heads to $0.22561
Will $ARIA surge upward or break downward?
Hopefully upward. This is just analysis.
#ARIA
#Crypto #Binance
#ARIAUSDT
Price now: $0.22998
24h change: +6.91%
24h high: $0.25964
24h low: $0.20617
Trading volume: $53.71M
After surging from $0.20617 to $0.25964 = +25.93%, $ARIA has started to squeeze inside a triangle!
📊 SuperTrend: $0.22816, green = trend is still bullish
Price is only +0.79% above it!
📊 RSI: 58.13 = above 50 = strong buying momentum
📊 Price: inside a narrow ascending triangle, with only 0.78% between the top and bottom
Resistance:
1. $0.23079 = triangle ceiling - breakout = surge
2. $0.25964 = 24h high
Support:
1. $0.22900 = triangle floor - breaking below it = correction
2. $0.22561
Break above $0.23079 = heads to $0.25964
Break below $0.22900 = heads to $0.22561
Will $ARIA surge upward or break downward?
Hopefully upward. This is just analysis.
#ARIA
#Crypto #Binance
#ARIAUSDT
1
48
·
--
Bullish
60
·
--
Bullish
A calm reversal
As expected.
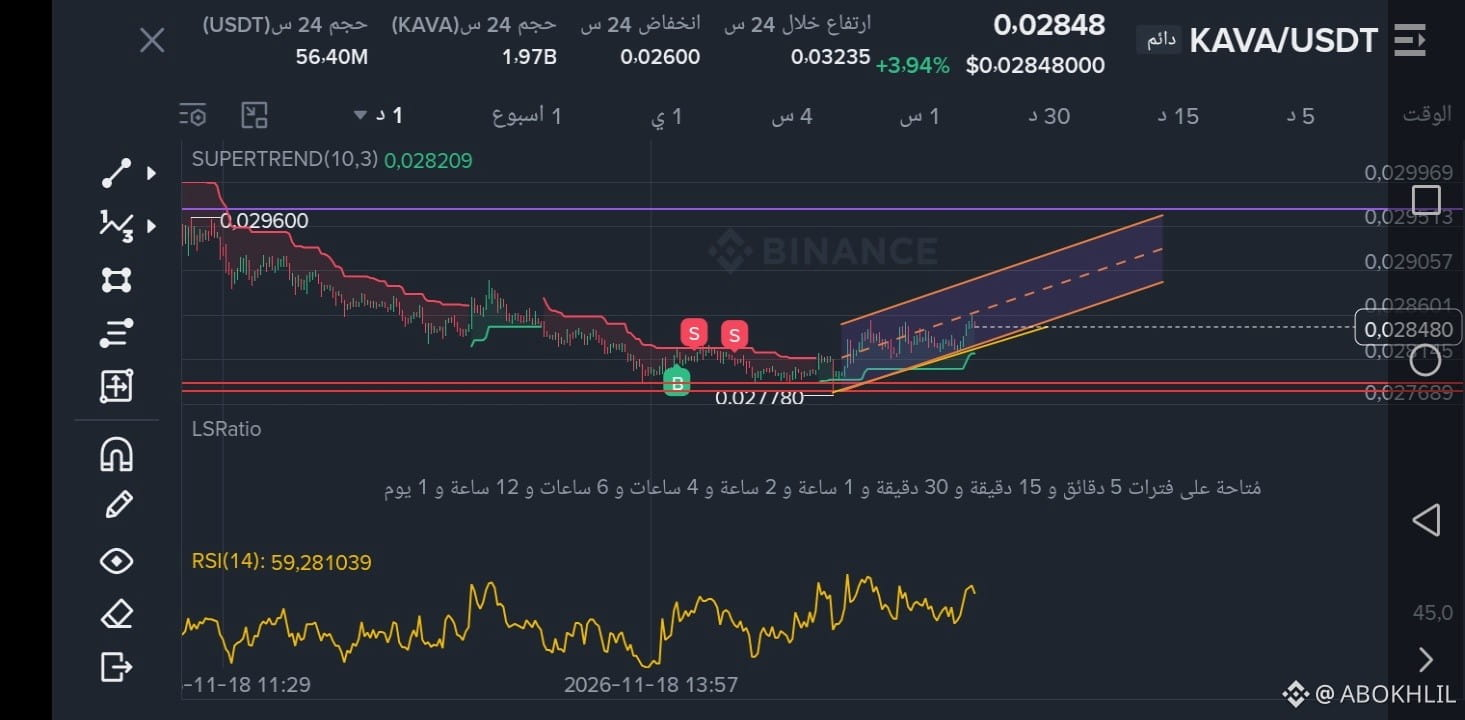
Price now: $0.02848
24h change: +3.94%
24h high: $0.03235
24h low: $0.02600
Trading volume: $56.40M
After dropping from $0.03235 to $0.02600 = -19.62%, $KAVA began building a bottom
📊 SuperTrend: $0.028209 Green = short-term trend turned bullish
Price is above it
📊 RSI: 59.28 = above 50 = strong buying momentum
📊 Price: inside a new ascending channel, bounced off its lower boundary at $0.02778
Resistance:
1. $0.02960 = old resistance — a breakout confirms the reversal!
2. $0.03235 = 24h high
Support:
1. $0.028209 = SuperTrend
2. $0.02778 = channel low — breaking below it means the reversal has failed
3. $0.02600 = 24h low
Holding above $0.028209 + breaking above $0.02960 = heads to $0.03235
Will $KAVA continue the reversal?
#KAVA
#Crypto
#Binance
A calm reversal
As expected.
Price now: $0.02848
24h change: +3.94%
24h high: $0.03235
24h low: $0.02600
Trading volume: $56.40M
After dropping from $0.03235 to $0.02600 = -19.62%, $KAVA began building a bottom
📊 SuperTrend: $0.028209 Green = short-term trend turned bullish
Price is above it
📊 RSI: 59.28 = above 50 = strong buying momentum
📊 Price: inside a new ascending channel, bounced off its lower boundary at $0.02778
Resistance:
1. $0.02960 = old resistance — a breakout confirms the reversal!
2. $0.03235 = 24h high
Support:
1. $0.028209 = SuperTrend
2. $0.02778 = channel low — breaking below it means the reversal has failed
3. $0.02600 = 24h low
Holding above $0.028209 + breaking above $0.02960 = heads to $0.03235
Will $KAVA continue the reversal?
#KAVA
#Crypto
#Binance
As expected.
Price now: $0.02848
24h change: +3.94%
24h high: $0.03235
24h low: $0.02600
Trading volume: $56.40M
After dropping from $0.03235 to $0.02600 = -19.62%, $KAVA began building a bottom
📊 SuperTrend: $0.028209 Green = short-term trend turned bullish
Price is above it
📊 RSI: 59.28 = above 50 = strong buying momentum
📊 Price: inside a new ascending channel, bounced off its lower boundary at $0.02778
Resistance:
1. $0.02960 = old resistance — a breakout confirms the reversal!
2. $0.03235 = 24h high
Support:
1. $0.028209 = SuperTrend
2. $0.02778 = channel low — breaking below it means the reversal has failed
3. $0.02600 = 24h low
Holding above $0.028209 + breaking above $0.02960 = heads to $0.03235
Will $KAVA continue the reversal?
#KAVA
#Crypto
#Binance
1
2
84
·
--
Bullish
🔥 MAGMA broke the downtrend and exploded
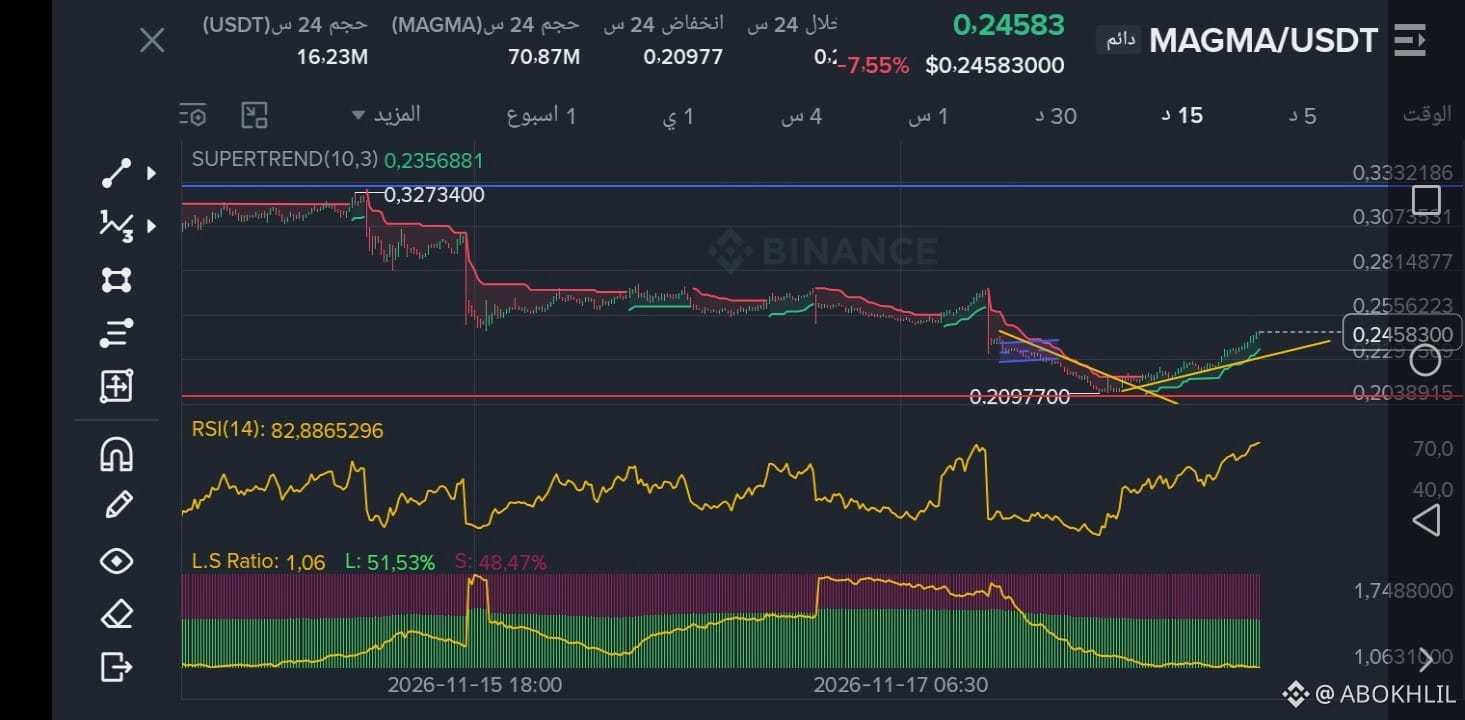
Price now: 0.24583$
24h change: -7.55%
24h low: 0.20977$
Trading volume: 16.23M$
After dropping from 0.32734$ to 0.20977$ = -35.9%, it exploded $MAGMA
{future}(MAGMAUSDT)
Analysis only
📊 SuperTrend: 0.23568$ green = uptrend
Price is +4.30% above it
📊 RSI: 82.88 = strongly overbought! = price needs to rest before continuing
📊 Breaking the yellow downtrend = the start of a true reversal!
📊 L.S Ratio: 1.06 = balanced = natural rise
Resistance:
1. 0.25562$
2. 0.28148$
3. 0.32734$
Support:
1. 0.23568$ = SuperTrend
2. 0.20977$ = reversal low
Holding above 0.23568$ = it continues to 0.28148$
Don't chase the price with RSI at 82; wait for a correction
Will $MAGMA continue the explosion?
#MAGMA
#Crypto
#Binance
#MAGMAUSDT
🔥 MAGMA broke the downtrend and exploded
Price now: 0.24583$
24h change: -7.55%
24h low: 0.20977$
Trading volume: 16.23M$
After dropping from 0.32734$ to 0.20977$ = -35.9%, it exploded $MAGMA
Analysis only
📊 SuperTrend: 0.23568$ green = uptrend
Price is +4.30% above it
📊 RSI: 82.88 = strongly overbought! = price needs to rest before continuing
📊 Breaking the yellow downtrend = the start of a true reversal!
📊 L.S Ratio: 1.06 = balanced = natural rise
Resistance:
1. 0.25562$
2. 0.28148$
3. 0.32734$
Support:
1. 0.23568$ = SuperTrend
2. 0.20977$ = reversal low
Holding above 0.23568$ = it continues to 0.28148$
Don't chase the price with RSI at 82; wait for a correction
Will $MAGMA continue the explosion?
#MAGMA
#Crypto
#Binance
#MAGMAUSDT
Price now: 0.24583$
24h change: -7.55%
24h low: 0.20977$
Trading volume: 16.23M$
After dropping from 0.32734$ to 0.20977$ = -35.9%, it exploded $MAGMA
Analysis only
📊 SuperTrend: 0.23568$ green = uptrend
Price is +4.30% above it
📊 RSI: 82.88 = strongly overbought! = price needs to rest before continuing
📊 Breaking the yellow downtrend = the start of a true reversal!
📊 L.S Ratio: 1.06 = balanced = natural rise
Resistance:
1. 0.25562$
2. 0.28148$
3. 0.32734$
Support:
1. 0.23568$ = SuperTrend
2. 0.20977$ = reversal low
Holding above 0.23568$ = it continues to 0.28148$
Don't chase the price with RSI at 82; wait for a correction
Will $MAGMA continue the explosion?
#MAGMA
#Crypto
#Binance
#MAGMAUSDT
1
87
·
--
Bullish
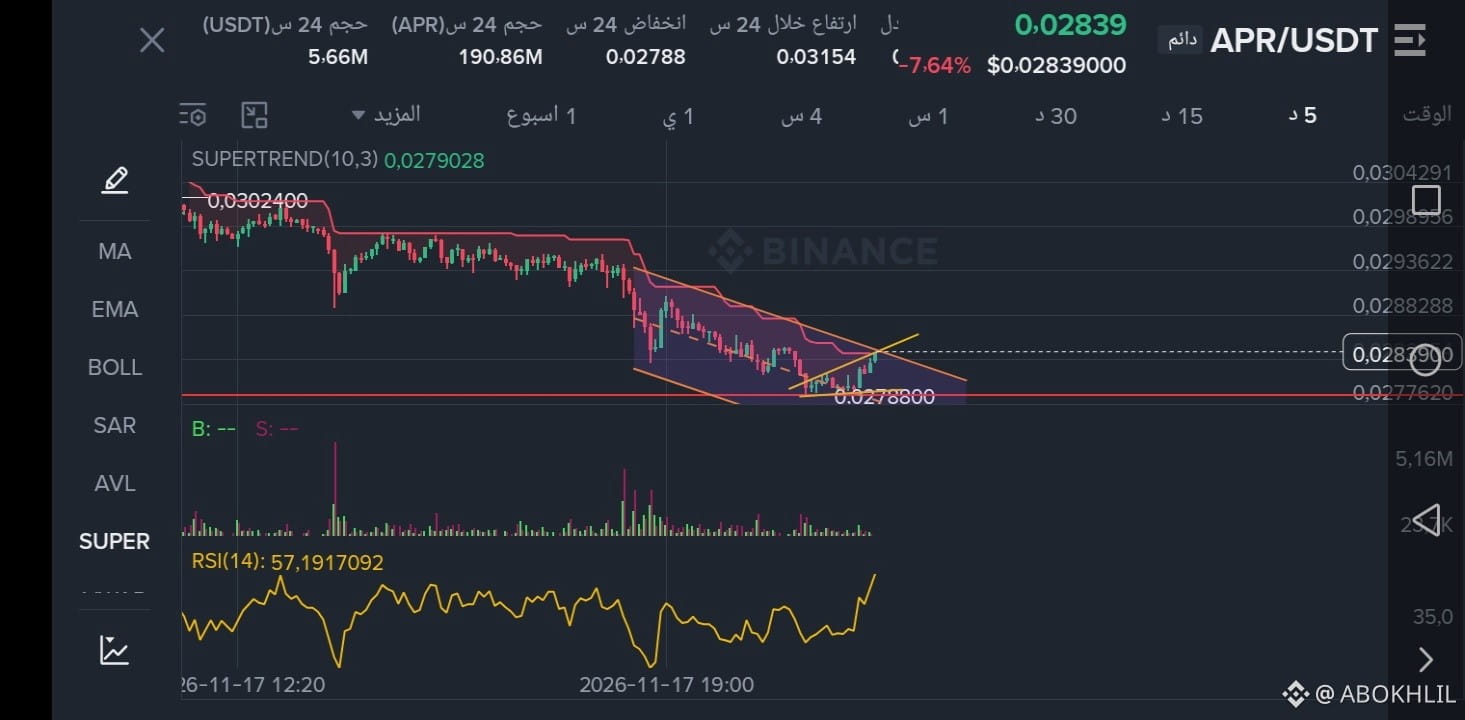
APR: Descending wedge and breakout nearby
Current price: 0.02839$
24h change: -7.64%
24h high: 0.03154$
24h low: 0.02788$
Trading volume: 5.66M$
$APR Clear descending wedge chart
📊 SuperTrend: 0.02790$ — red, but the price is above it = about to turn green
📊 RSI: 57.19 = above 50 = strong buying momentum!
📊 Price: 0.02839$ = sitting at the wedge ceiling of 0.02882$
Resistance:
1. 0.02882$ = wedge ceiling — breakout = takeoff!
2. 0.02936$
3. 0.03154$ = 24h high
Support:
1. 0.02790$ = SuperTrend
2. 0.02788$ = 24h low — breaking it = wedge failure
A breakout above 0.02882$ = heads to 0.03024$!
A break below 0.02788$ = price drops again
Do you expect $APR
{future}(APRUSDT)
to break the wedge upward or break the low downward?
For monitoring
From the bottom. Personal opinion and analysis.
#APR
#Crypto
#Binance
#APRUSDT
APR: Descending wedge and breakout nearby
Current price: 0.02839$
24h change: -7.64%
24h high: 0.03154$
24h low: 0.02788$
Trading volume: 5.66M$
$APR Clear descending wedge chart
📊 SuperTrend: 0.02790$ — red, but the price is above it = about to turn green
📊 RSI: 57.19 = above 50 = strong buying momentum!
📊 Price: 0.02839$ = sitting at the wedge ceiling of 0.02882$
Resistance:
1. 0.02882$ = wedge ceiling — breakout = takeoff!
2. 0.02936$
3. 0.03154$ = 24h high
Support:
1. 0.02790$ = SuperTrend
2. 0.02788$ = 24h low — breaking it = wedge failure
A breakout above 0.02882$ = heads to 0.03024$!
A break below 0.02788$ = price drops again
Do you expect $APR
to break the wedge upward or break the low downward?
For monitoring
From the bottom. Personal opinion and analysis.
#APR
#Crypto
#Binance
#APRUSDT
Current price: 0.02839$
24h change: -7.64%
24h high: 0.03154$
24h low: 0.02788$
Trading volume: 5.66M$
$APR Clear descending wedge chart
📊 SuperTrend: 0.02790$ — red, but the price is above it = about to turn green
📊 RSI: 57.19 = above 50 = strong buying momentum!
📊 Price: 0.02839$ = sitting at the wedge ceiling of 0.02882$
Resistance:
1. 0.02882$ = wedge ceiling — breakout = takeoff!
2. 0.02936$
3. 0.03154$ = 24h high
Support:
1. 0.02790$ = SuperTrend
2. 0.02788$ = 24h low — breaking it = wedge failure
A breakout above 0.02882$ = heads to 0.03024$!
A break below 0.02788$ = price drops again
Do you expect $APR
to break the wedge upward or break the low downward?
For monitoring
From the bottom. Personal opinion and analysis.
#APR
#Crypto
#Binance
#APRUSDT
12
·
--
Bullish
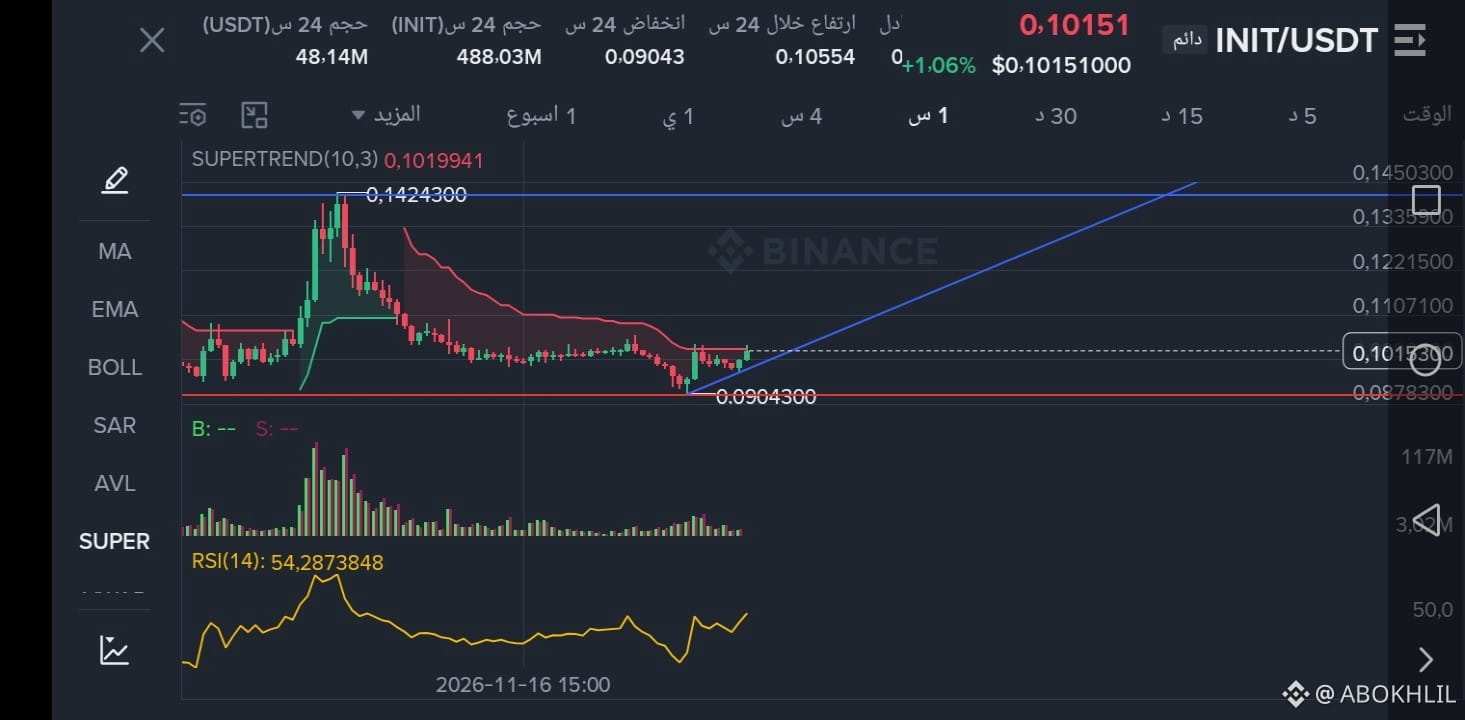
#INIT From here, closing and confirmation are necessary—the spark of an upswing
$INIT
{future}(INITUSDT)
Rocket... flying!
Good luck; just my personal opinion.
#INIT From here, closing and confirmation are necessary—the spark of an upswing
$INIT
Rocket... flying!
Good luck; just my personal opinion.
$INIT
Rocket... flying!
Good luck; just my personal opinion.
23
·
--
Bullish
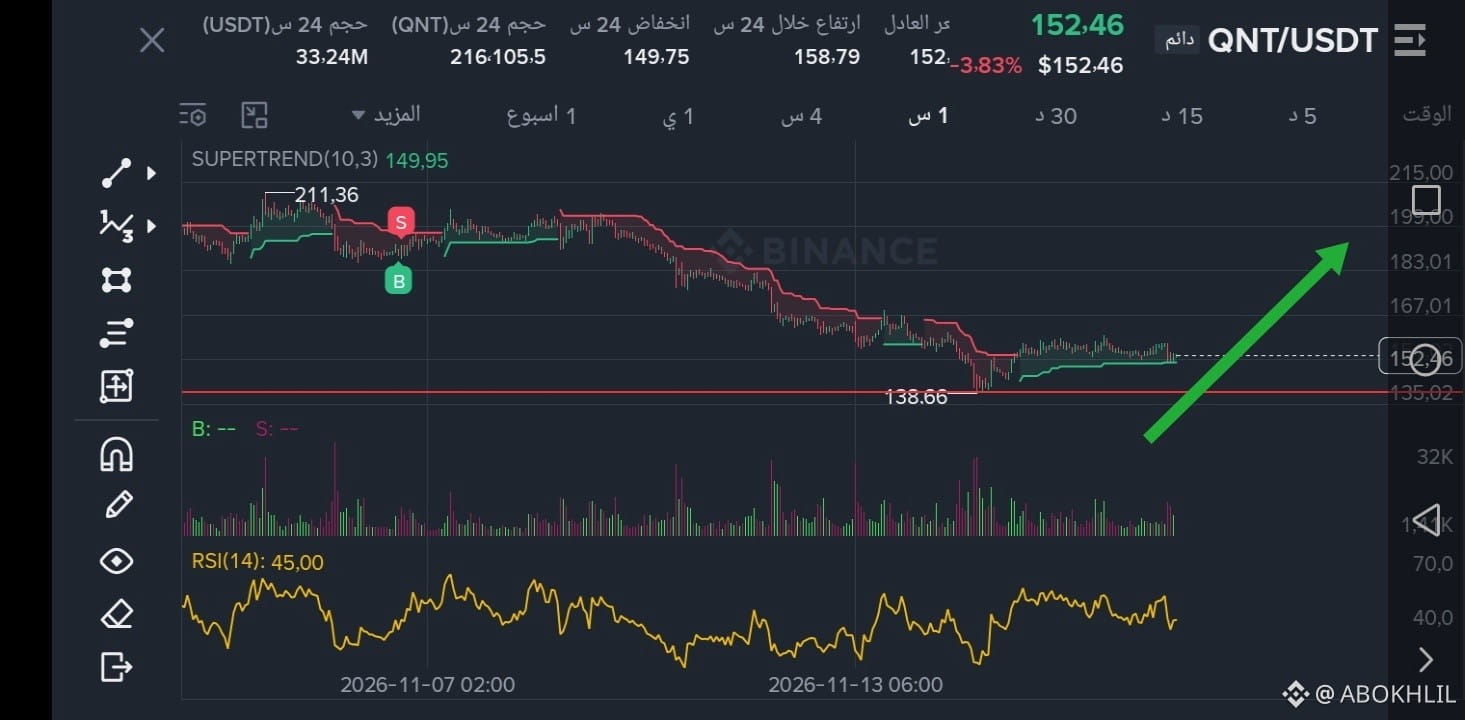
👀 QNT: Building a new bottom... and this bottom could be the launchpad upward...
Price now: 152.46$
24h change: -3.83%
24h high: 158.79$
24h low: 149.75$
Trading volume: 33.24M$
After dropping from 211.36$ to 138.66$, it started accumulating $QNT
📊 SuperTrend: 149.95$ Green = short-term trend has turned bullish
Price is above
📊 RSI: 45.00 = below 50 = still needs strength; it needs to break above 50 to rise
Resistance:
1. 158.79$ = accumulation ceiling — breakout = takeoff
2. 167.01$
3. 183.01$
Support:
1. 149.95$ = SuperTrend
2. 138.66$ = crash low
Break above 158.79$ = moves to 167$, then 183$
Break below 149.75$ = returns to 138.66$
$QNT
{future}(QNTUSDT)
Analysis and suggestion, not financial advice. Good luck!
#QNT
#Crypto
#QNT/USDT
#QNTUSDT
#QNT500
👀 QNT: Building a new bottom... and this bottom could be the launchpad upward...
Price now: 152.46$
24h change: -3.83%
24h high: 158.79$
24h low: 149.75$
Trading volume: 33.24M$
After dropping from 211.36$ to 138.66$, it started accumulating $QNT
📊 SuperTrend: 149.95$ Green = short-term trend has turned bullish
Price is above
📊 RSI: 45.00 = below 50 = still needs strength; it needs to break above 50 to rise
Resistance:
1. 158.79$ = accumulation ceiling — breakout = takeoff
2. 167.01$
3. 183.01$
Support:
1. 149.95$ = SuperTrend
2. 138.66$ = crash low
Break above 158.79$ = moves to 167$, then 183$
Break below 149.75$ = returns to 138.66$
$QNT
Analysis and suggestion, not financial advice. Good luck!
#QNT
#Crypto
#QNT/USDT
#QNTUSDT
#QNT500
Price now: 152.46$
24h change: -3.83%
24h high: 158.79$
24h low: 149.75$
Trading volume: 33.24M$
After dropping from 211.36$ to 138.66$, it started accumulating $QNT
📊 SuperTrend: 149.95$ Green = short-term trend has turned bullish
Price is above
📊 RSI: 45.00 = below 50 = still needs strength; it needs to break above 50 to rise
Resistance:
1. 158.79$ = accumulation ceiling — breakout = takeoff
2. 167.01$
3. 183.01$
Support:
1. 149.95$ = SuperTrend
2. 138.66$ = crash low
Break above 158.79$ = moves to 167$, then 183$
Break below 149.75$ = returns to 138.66$
$QNT
Analysis and suggestion, not financial advice. Good luck!
#QNT
#Crypto
#QNT/USDT
#QNTUSDT
#QNT500
1
50
·
--
Bullish
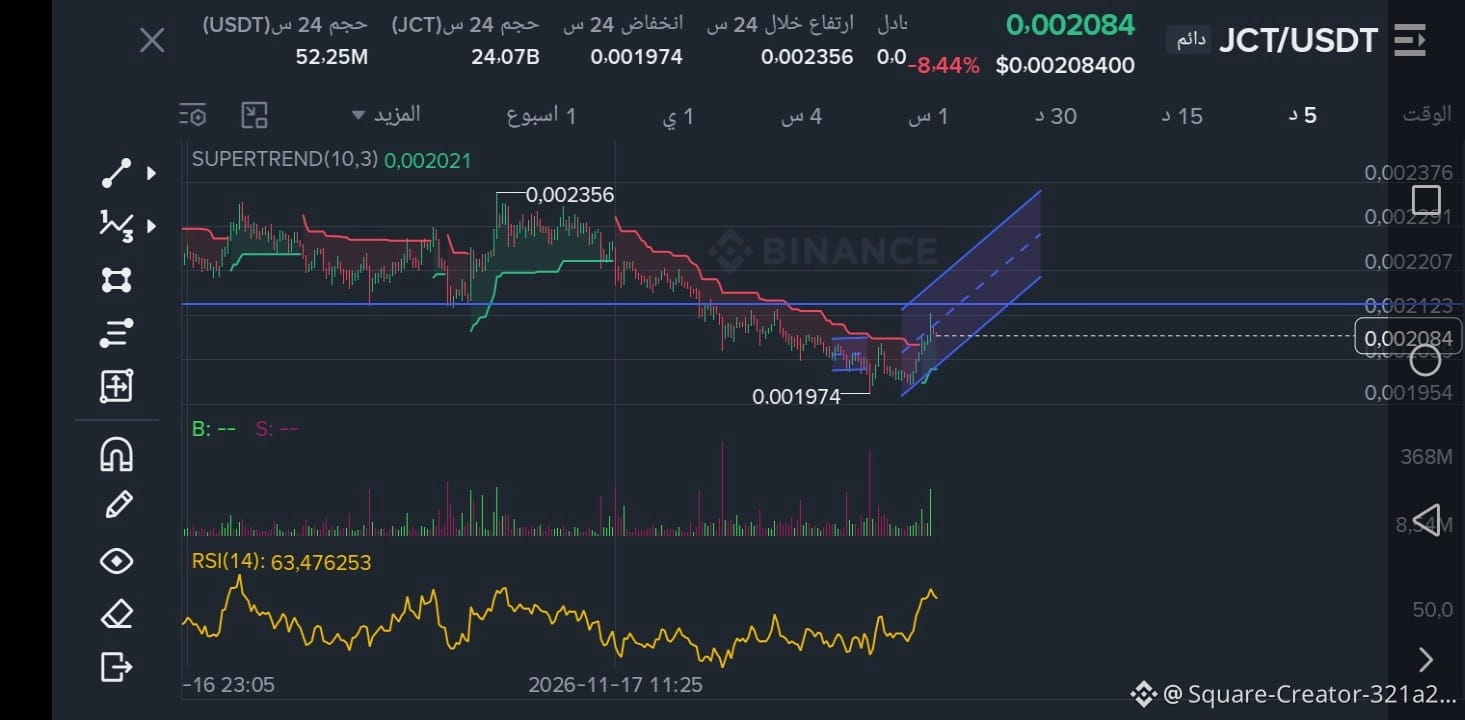
JCT has finally started to reverse
Price now: $0.002084
24h change: -8.44%
24h high: $0.002356
24h low: $0.001974
Trading volume: $52.25M
After breaking $0.002015, it made a false break to $0.001974, then bounced $JCT strongly
📊 SuperTrend: $0.002021 turned from red to green = first bullish reversal
📊 RSI: rose from 33 to 63.47 = buying momentum exploded!
📊 Price: inside a new ascending channel
Resistance:
1. $0.002123 = channel ceiling
2. $0.002356 = 24h high
3. $0.002444
Support:
1. $0.002021 = SuperTrend
2. $0.001974 = false-break low
Holding above $0.002021 + breaking through $0.002123 = the way is clear to $0.002356!
$JCT
{future}(JCTUSDT)
From here, the rise and the real reversal... God willing.
Just analysis and personal opinion..
#JCT
#Crypto
#Binance
#JCTUSDT
JCT has finally started to reverse
Price now: $0.002084
24h change: -8.44%
24h high: $0.002356
24h low: $0.001974
Trading volume: $52.25M
After breaking $0.002015, it made a false break to $0.001974, then bounced $JCT strongly
📊 SuperTrend: $0.002021 turned from red to green = first bullish reversal
📊 RSI: rose from 33 to 63.47 = buying momentum exploded!
📊 Price: inside a new ascending channel
Resistance:
1. $0.002123 = channel ceiling
2. $0.002356 = 24h high
3. $0.002444
Support:
1. $0.002021 = SuperTrend
2. $0.001974 = false-break low
Holding above $0.002021 + breaking through $0.002123 = the way is clear to $0.002356!
$JCT
From here, the rise and the real reversal... God willing.
Just analysis and personal opinion..
#JCT
#Crypto
#Binance
#JCTUSDT
Price now: $0.002084
24h change: -8.44%
24h high: $0.002356
24h low: $0.001974
Trading volume: $52.25M
After breaking $0.002015, it made a false break to $0.001974, then bounced $JCT strongly
📊 SuperTrend: $0.002021 turned from red to green = first bullish reversal
📊 RSI: rose from 33 to 63.47 = buying momentum exploded!
📊 Price: inside a new ascending channel
Resistance:
1. $0.002123 = channel ceiling
2. $0.002356 = 24h high
3. $0.002444
Support:
1. $0.002021 = SuperTrend
2. $0.001974 = false-break low
Holding above $0.002021 + breaking through $0.002123 = the way is clear to $0.002356!
$JCT
From here, the rise and the real reversal... God willing.
Just analysis and personal opinion..
#JCT
#Crypto
#Binance
#JCTUSDT
1
37
·
--
Bearish
#BTC
#BTC走势分析
#btc70k
#BTC突破7万大关
#BTC☀
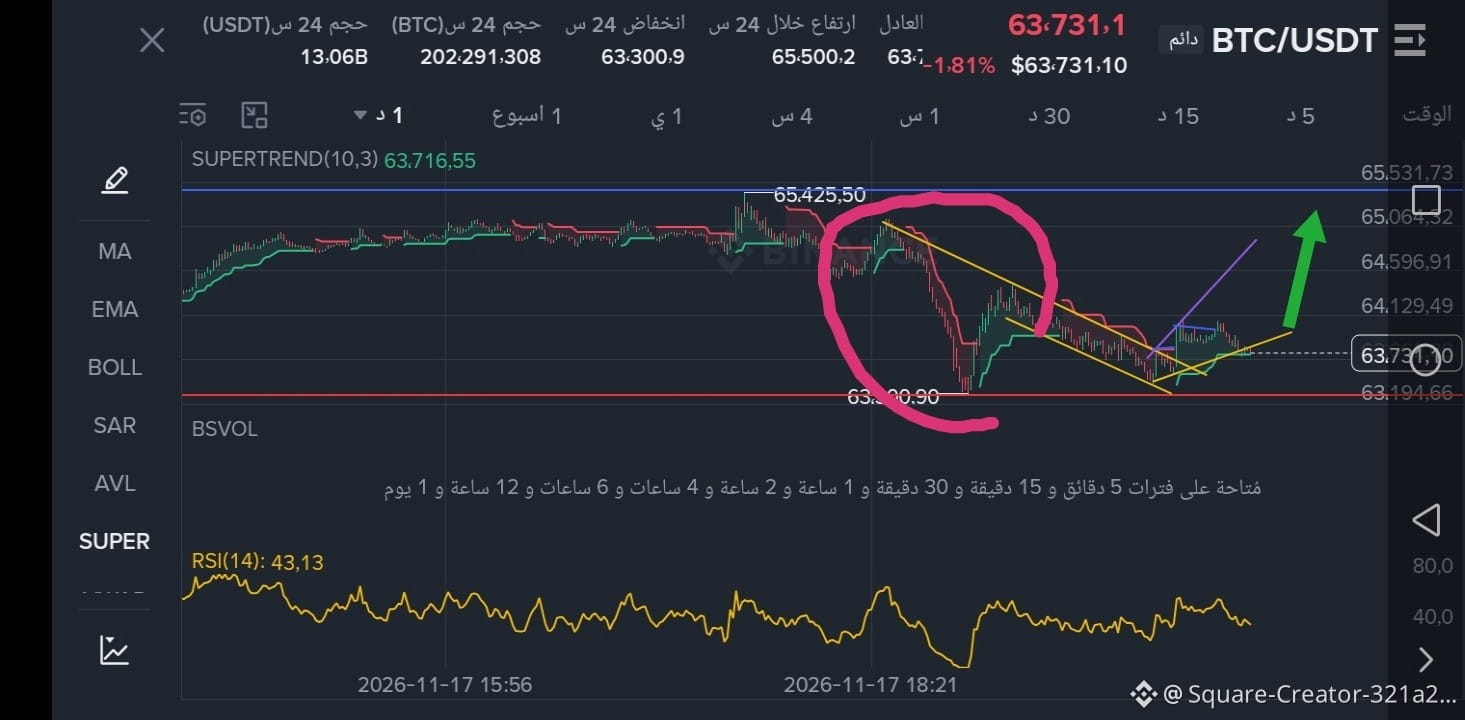
(The sea has no mercy on an inexperienced swimmer)
Perhaps 63.000 is the new bottom for Bitcoin.
And the theory that after every major drop comes a sudden rise.
I hope the ascending wedge is a reliable sign that Bitcoin is taking off from this new bottom.
$BTC
{future}(BTCUSDT)
A major drop and very slow upward fluctuation from this bottom.
Just analysis and a suggestion, not financial advice.
Good luck to everyone.
#BTC
#BTC走势分析
#btc70k
#BTC突破7万大关
#BTC☀
(The sea has no mercy on an inexperienced swimmer)
Perhaps 63.000 is the new bottom for Bitcoin.
And the theory that after every major drop comes a sudden rise.
I hope the ascending wedge is a reliable sign that Bitcoin is taking off from this new bottom.
$BTC
A major drop and very slow upward fluctuation from this bottom.
Just analysis and a suggestion, not financial advice.
Good luck to everyone.
#BTC走势分析
#btc70k
#BTC突破7万大关
#BTC☀
(The sea has no mercy on an inexperienced swimmer)
Perhaps 63.000 is the new bottom for Bitcoin.
And the theory that after every major drop comes a sudden rise.
I hope the ascending wedge is a reliable sign that Bitcoin is taking off from this new bottom.
$BTC
A major drop and very slow upward fluctuation from this bottom.
Just analysis and a suggestion, not financial advice.
Good luck to everyone.
1
5
·
--
Bullish
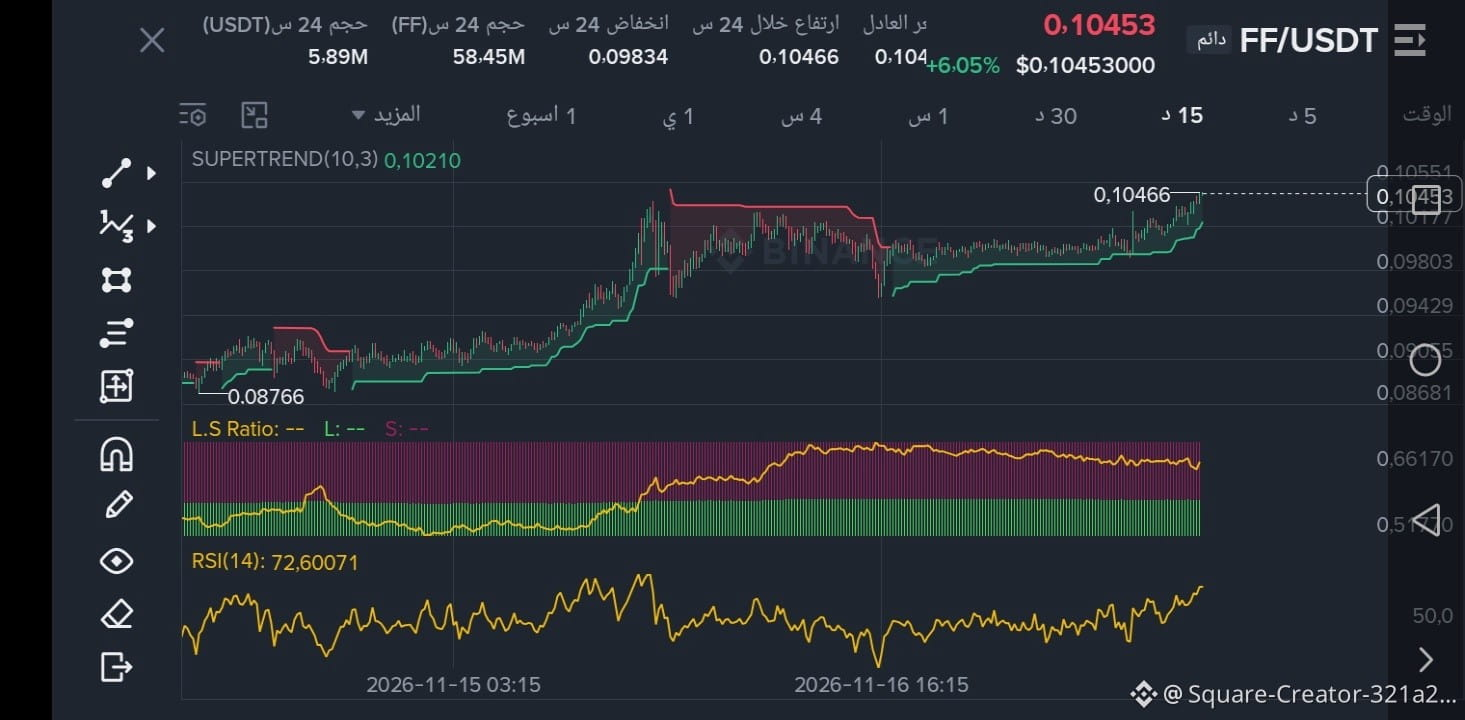
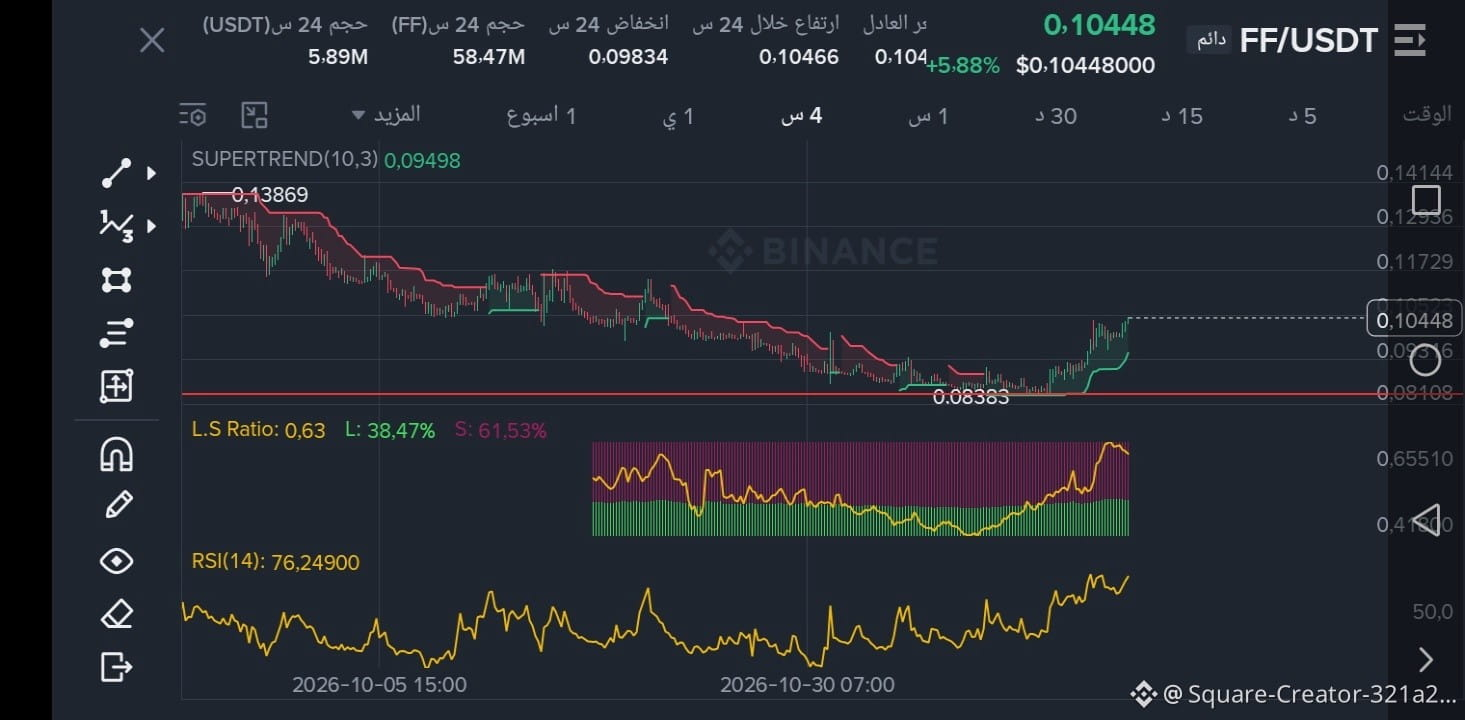
🔥🔥 FF... coming up, worth following and keeping an eye on
Price now: 0.10402$
24h change: +4.95%
24h high: 0.10433$
24h low: 0.09834$
Trading volume: 5.87M$
📊 SuperTrend: 0.10257$ Green = uptrend
📊 RSI: 63.23 = strong buying momentum, still far from overbought
📊 L.S Ratio: 0.63 = 61.32% SHORT! = fuel for a Short Squeeze
Price is now sitting at the 0.10433$ high
Resistance
1. 0.10433$ = 24h high
2. 0.11000$
3. 0.12000$
Support:
1. 0.10257$ = SuperTrend
2. 0.09834$ = 24h low
A breakout above 0.10433$ = a launch to 0.11$ due to SHORT liquidations
Do you expect $FF
#ff
{future}(FFUSDT)
the rally to continue?
Just analysis, good luck
#FF
#Crypto
#Binance
#FFUSDT
🔥🔥 FF... coming up, worth following and keeping an eye on
Price now: 0.10402$
24h change: +4.95%
24h high: 0.10433$
24h low: 0.09834$
Trading volume: 5.87M$
📊 SuperTrend: 0.10257$ Green = uptrend
📊 RSI: 63.23 = strong buying momentum, still far from overbought
📊 L.S Ratio: 0.63 = 61.32% SHORT! = fuel for a Short Squeeze
Price is now sitting at the 0.10433$ high
Resistance
1. 0.10433$ = 24h high
2. 0.11000$
3. 0.12000$
Support:
1. 0.10257$ = SuperTrend
2. 0.09834$ = 24h low
A breakout above 0.10433$ = a launch to 0.11$ due to SHORT liquidations
Do you expect $FF
#ff
the rally to continue?
Just analysis, good luck
#FF
#Crypto
#Binance
#FFUSDT
Price now: 0.10402$
24h change: +4.95%
24h high: 0.10433$
24h low: 0.09834$
Trading volume: 5.87M$
📊 SuperTrend: 0.10257$ Green = uptrend
📊 RSI: 63.23 = strong buying momentum, still far from overbought
📊 L.S Ratio: 0.63 = 61.32% SHORT! = fuel for a Short Squeeze
Price is now sitting at the 0.10433$ high
Resistance
1. 0.10433$ = 24h high
2. 0.11000$
3. 0.12000$
Support:
1. 0.10257$ = SuperTrend
2. 0.09834$ = 24h low
A breakout above 0.10433$ = a launch to 0.11$ due to SHORT liquidations
Do you expect $FF
#ff
the rally to continue?
Just analysis, good luck
#FF
#Crypto
#Binance
#FFUSDT
1
15
·
--
Bullish
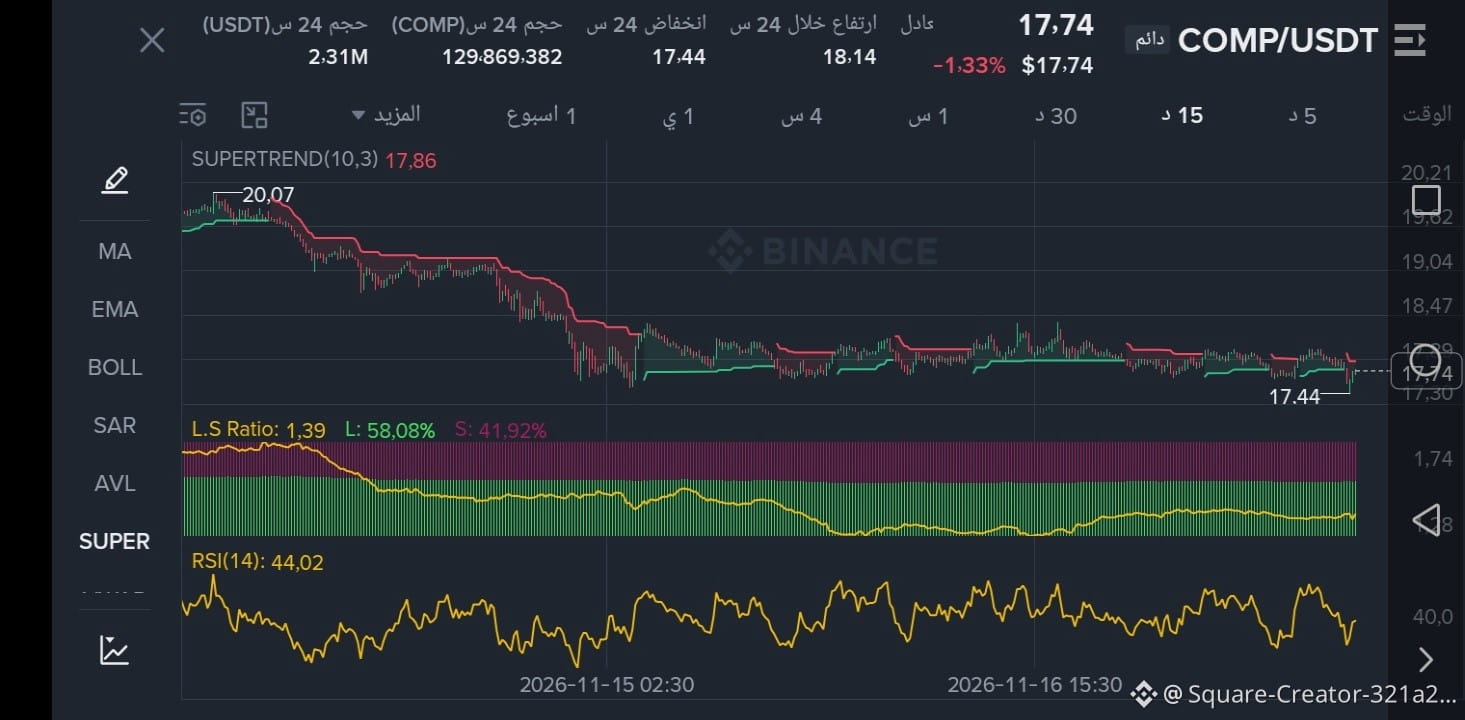
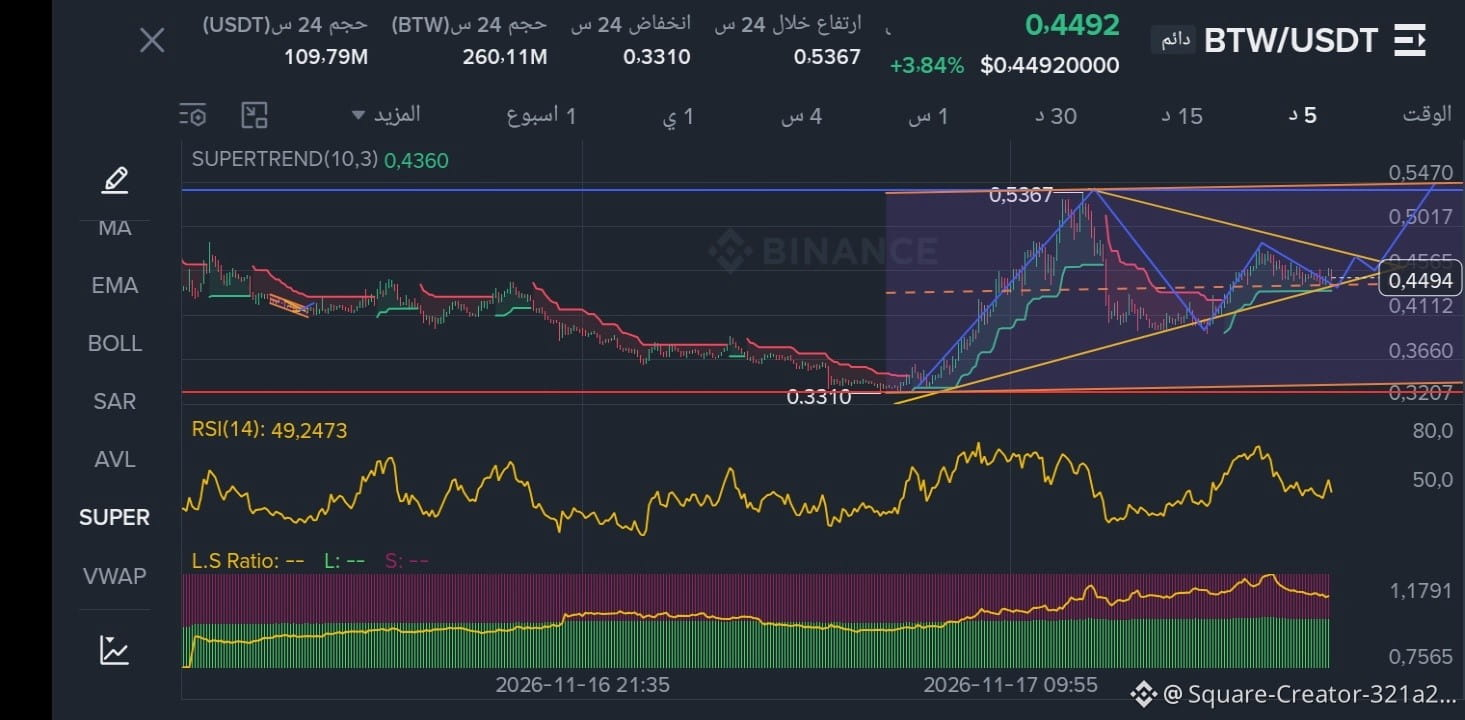
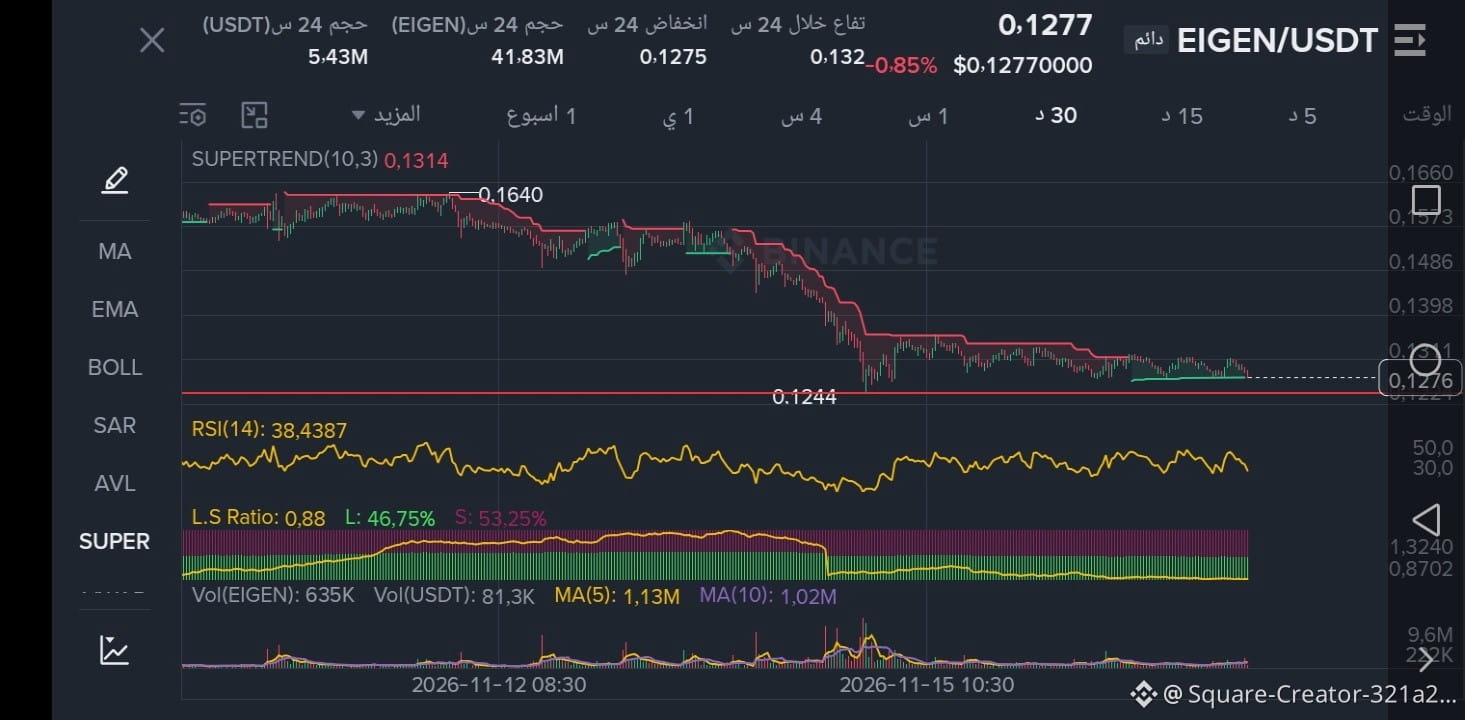
#Comp
#SUİ
#IDOL
#velve
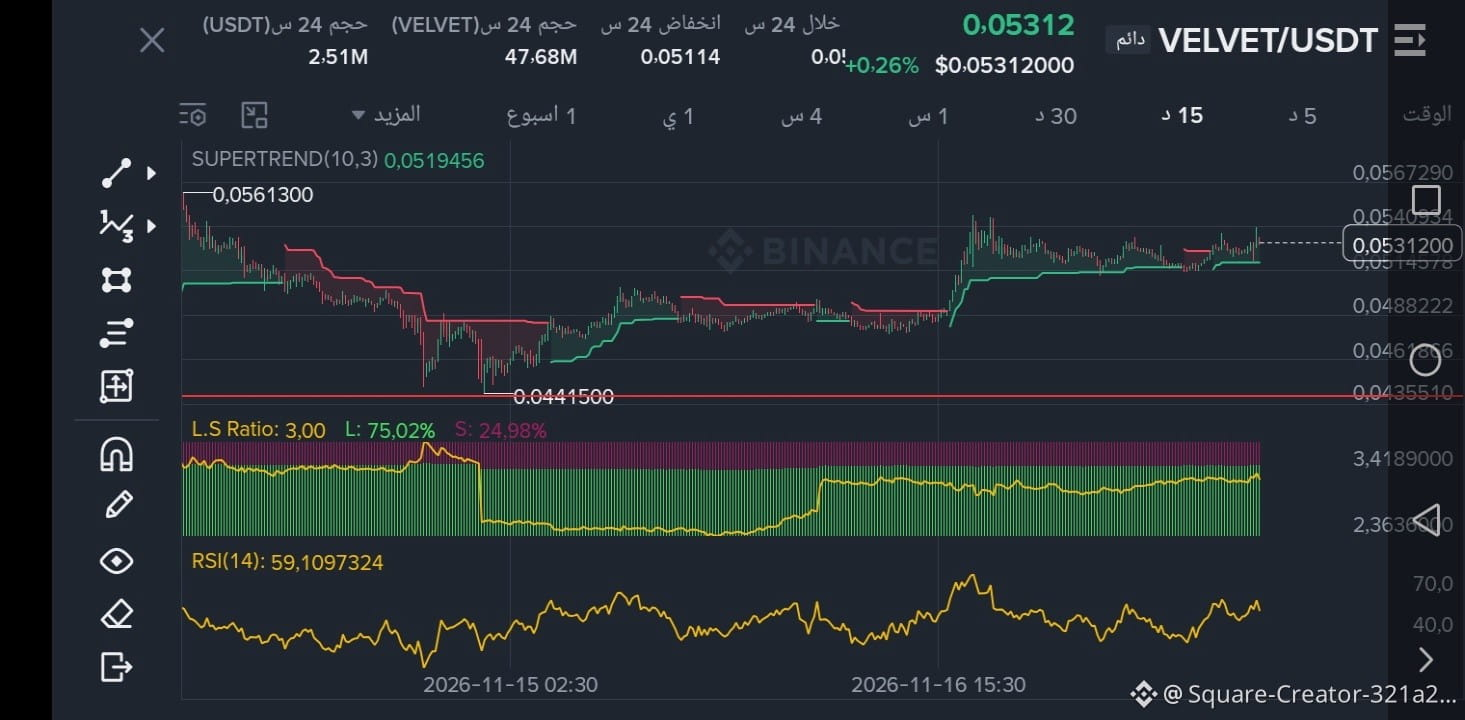
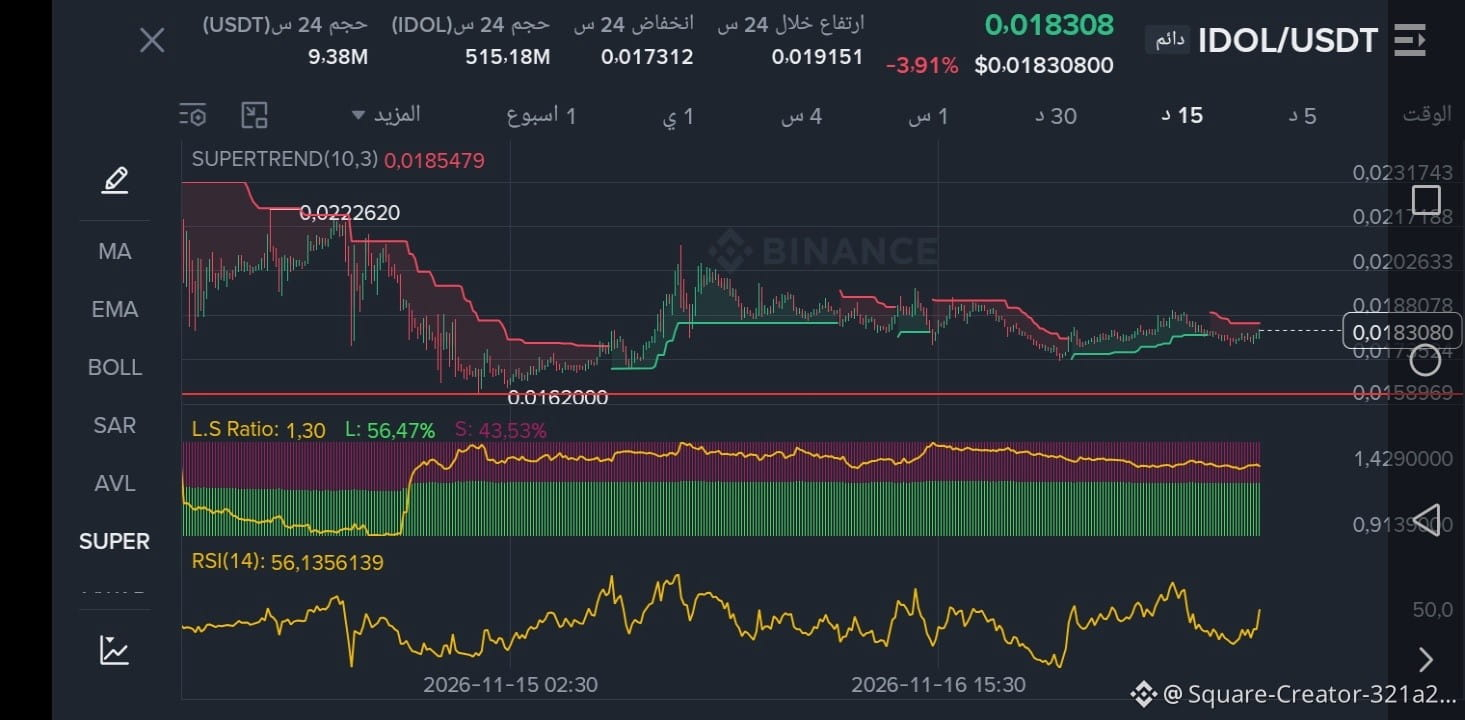
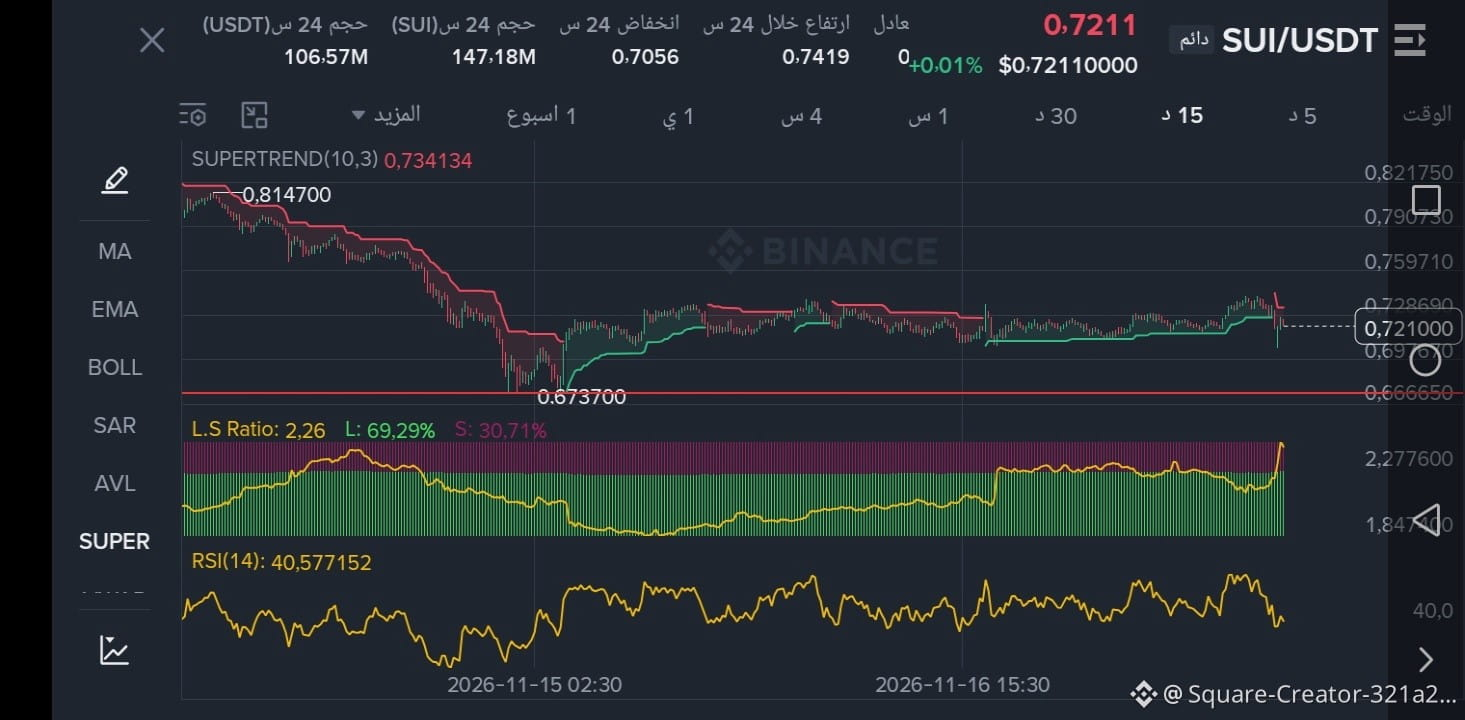
Beginning of a rise, bullish fluctuations, and formation of an upward trend
after breaking the downtrend.
Just an analysis. Good luck to everyone, God willing.
Monitoring is necessary.
$COMP
{future}(COMPUSDT)
$SUI
{future}(SUIUSDT)
$IDOL
{future}(IDOLUSDT)
#عملات_رقمية
#Comp
#SUİ
#IDOL
#velve
Beginning of a rise, bullish fluctuations, and formation of an upward trend
after breaking the downtrend.
Just an analysis. Good luck to everyone, God willing.
Monitoring is necessary.
$COMP
$SUI
$IDOL
#عملات_رقمية
#SUİ
#IDOL
#velve
Beginning of a rise, bullish fluctuations, and formation of an upward trend
after breaking the downtrend.
Just an analysis. Good luck to everyone, God willing.
Monitoring is necessary.
$COMP
$SUI
$IDOL
#عملات_رقمية
1
10
·
--
Bullish
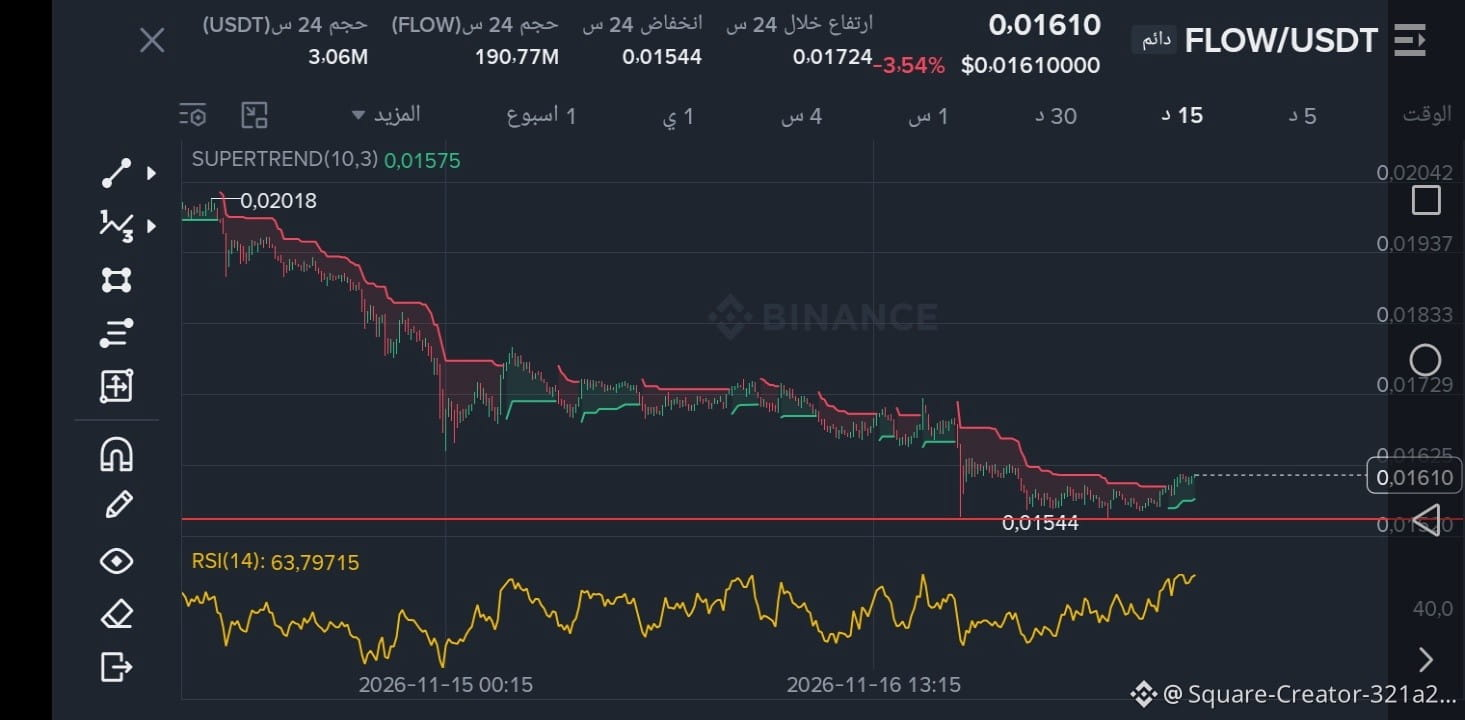
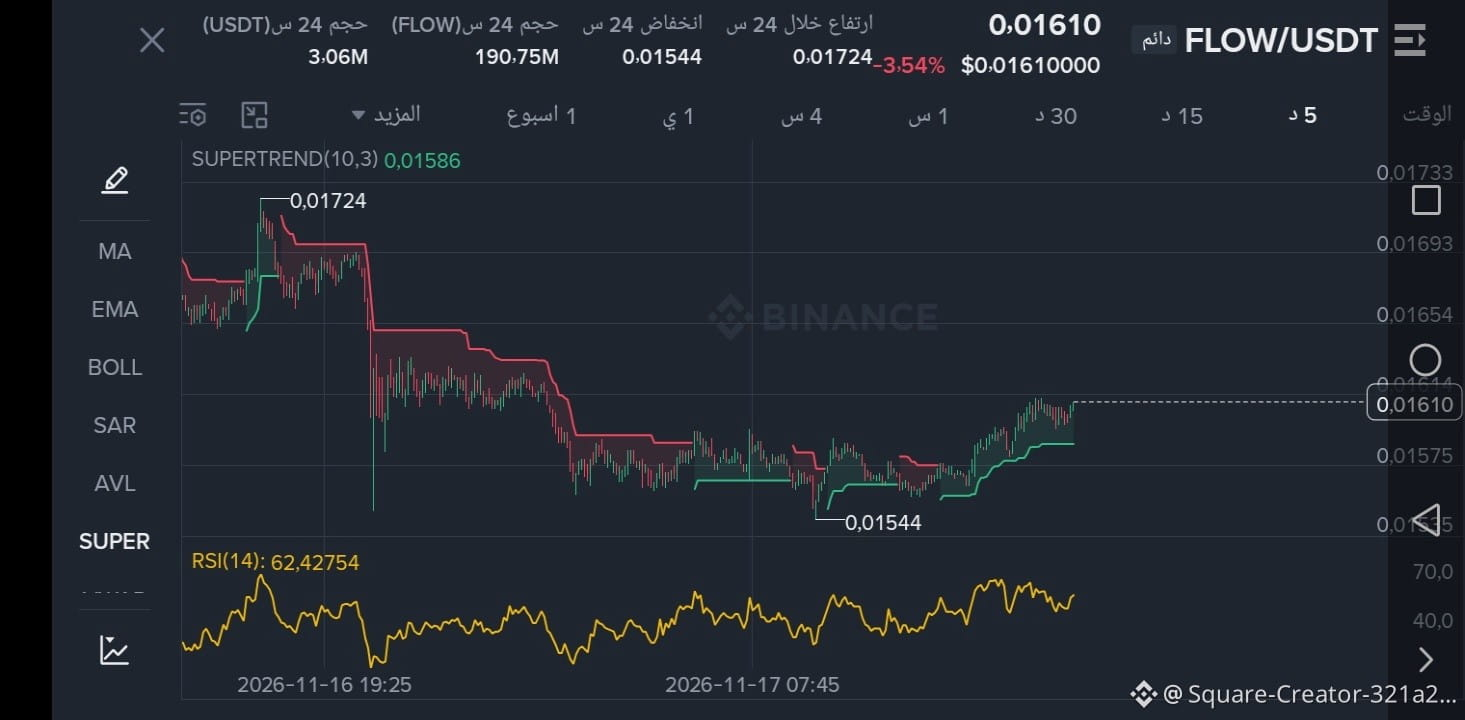
FLOW Has the reversal started from the bottom?
Current price: 0.01609
24h change: -3.77%
24h high: 0.01724
24h low: 0.01544
Trading volume: 3.06M
After a drop from 0.01799 to $0.01544
SuperTrend flipped from red to green at 0.01574, the first bullish reversal signal
📊 RSI rose from 35 to 63.33
Buying momentum has returned strongly
Price is above SuperTrend
Holding above support
Resistance
1. $0.01643
2. $0.01699
Support:
1. 0.01574 = SuperTrend
2. 0.01544 = 24h low
Holding above 0.01574 + breaking through 0.01643 = the way is open to 0.01699
Will $FLOW continue the bullish reversal?
{future}(FLOWUSDT)
Analysis and monitoring, not financial advice.
#BR Bullish, as we predicted earlier
#M Bullish, as we predicted
#FLOW
#FLOWUSDT
$M
{future}(MUSDT)
$BR
FLOW Has the reversal started from the bottom?
Current price: 0.01609
24h change: -3.77%
24h high: 0.01724
24h low: 0.01544
Trading volume: 3.06M
After a drop from 0.01799 to $0.01544
SuperTrend flipped from red to green at 0.01574, the first bullish reversal signal
📊 RSI rose from 35 to 63.33
Buying momentum has returned strongly
Price is above SuperTrend
Holding above support
Resistance
1. $0.01643
2. $0.01699
Support:
1. 0.01574 = SuperTrend
2. 0.01544 = 24h low
Holding above 0.01574 + breaking through 0.01643 = the way is open to 0.01699
Will $FLOW continue the bullish reversal?
Analysis and monitoring, not financial advice.
#BR Bullish, as we predicted earlier
#M Bullish, as we predicted
#FLOW
#FLOWUSDT
$M
$BR
Current price: 0.01609
24h change: -3.77%
24h high: 0.01724
24h low: 0.01544
Trading volume: 3.06M
After a drop from 0.01799 to $0.01544
SuperTrend flipped from red to green at 0.01574, the first bullish reversal signal
📊 RSI rose from 35 to 63.33
Buying momentum has returned strongly
Price is above SuperTrend
Holding above support
Resistance
1. $0.01643
2. $0.01699
Support:
1. 0.01574 = SuperTrend
2. 0.01544 = 24h low
Holding above 0.01574 + breaking through 0.01643 = the way is open to 0.01699
Will $FLOW continue the bullish reversal?
Analysis and monitoring, not financial advice.
#BR Bullish, as we predicted earlier
#M Bullish, as we predicted
#FLOW
#FLOWUSDT
$M
$BR
1
48
·
--
Bullish
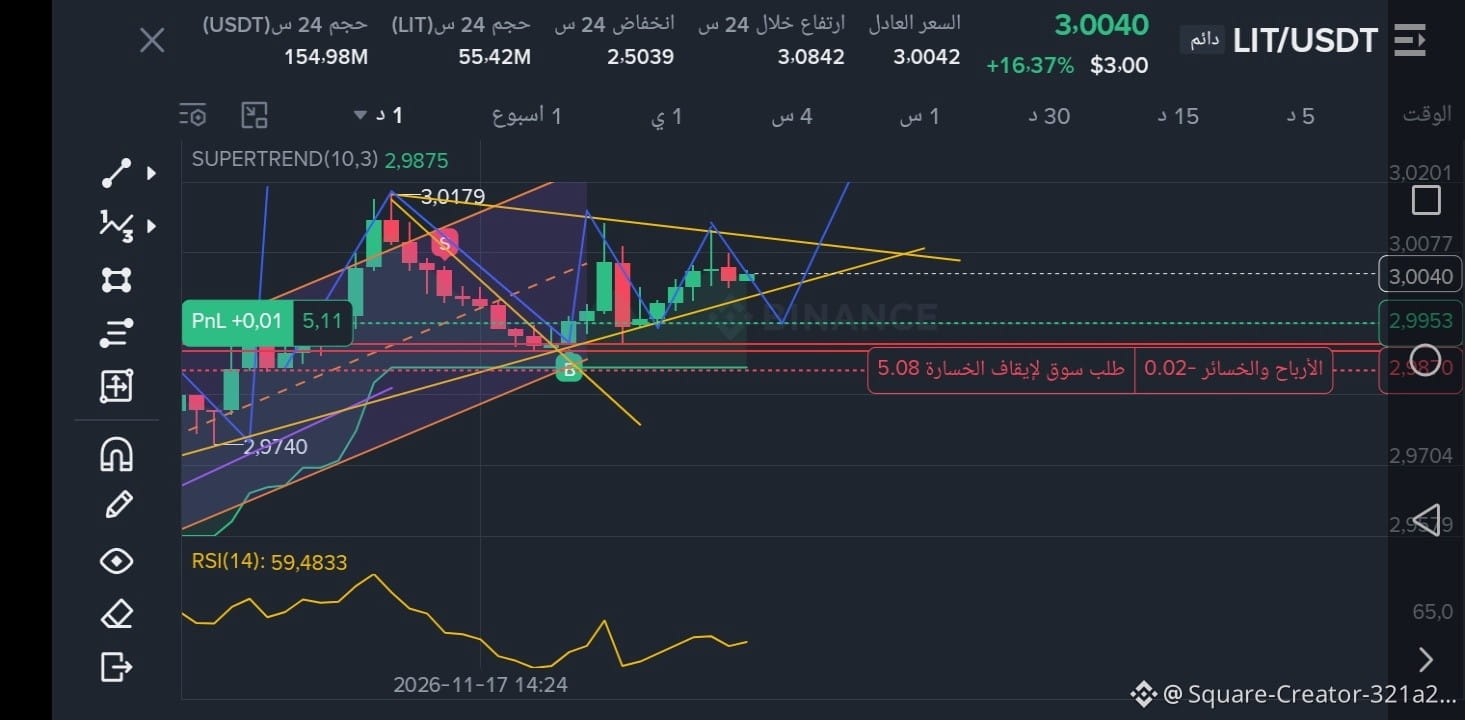
🔥🔥 $LIT
Officially broke above $3
Price now: $3.0040
24h change: +16.37%
24h high: $3.0842
24h low: $2.5039
Trading volume: $154.98M
From a low of $2.5039 to $3.0040 = +20% 🚀
LIT was holding at support at $2.5188.
It held above it and bounced strongly.
Then it entered an ascending channel and broke through its ceiling at $2.9891. After that, it broke through the psychological $3.00 level and held above it!
📊 RSI: 59.48 = healthy zone, with room to rise
📊 SuperTrend: $2.9875, green = the trend is still bullish
📊 Price: above $3.00 = breakout confirmed
Key levels:
Resistance:
1. $3.0179 = recent high
2. $3.0242 = next resistance
3. $3.0842 = 24h high
Support:
1. $3.00 = psychological level
2. $2.9891 = broken channel ceiling
3. $2.9875 = SuperTrend
Holding above $3.00 = the way is clear to $3.0242, then $3.0842.
There is a chance of an explosive move upward, based on the reading.
This is not financial advice, but rather my personal analysis.
Good luck to everyone, God willing.
$LIT
#LIT
#Crypto
#Binance
#LITUSDT
🔥🔥 $LIT
Officially broke above $3
Price now: $3.0040
24h change: +16.37%
24h high: $3.0842
24h low: $2.5039
Trading volume: $154.98M
From a low of $2.5039 to $3.0040 = +20% 🚀
LIT was holding at support at $2.5188.
It held above it and bounced strongly.
Then it entered an ascending channel and broke through its ceiling at $2.9891. After that, it broke through the psychological $3.00 level and held above it!
📊 RSI: 59.48 = healthy zone, with room to rise
📊 SuperTrend: $2.9875, green = the trend is still bullish
📊 Price: above $3.00 = breakout confirmed
Key levels:
Resistance:
1. $3.0179 = recent high
2. $3.0242 = next resistance
3. $3.0842 = 24h high
Support:
1. $3.00 = psychological level
2. $2.9891 = broken channel ceiling
3. $2.9875 = SuperTrend
Holding above $3.00 = the way is clear to $3.0242, then $3.0842.
There is a chance of an explosive move upward, based on the reading.
This is not financial advice, but rather my personal analysis.
Good luck to everyone, God willing.
$LIT
#LIT
#Crypto
#Binance
#LITUSDT
Officially broke above $3
Price now: $3.0040
24h change: +16.37%
24h high: $3.0842
24h low: $2.5039
Trading volume: $154.98M
From a low of $2.5039 to $3.0040 = +20% 🚀
LIT was holding at support at $2.5188.
It held above it and bounced strongly.
Then it entered an ascending channel and broke through its ceiling at $2.9891. After that, it broke through the psychological $3.00 level and held above it!
📊 RSI: 59.48 = healthy zone, with room to rise
📊 SuperTrend: $2.9875, green = the trend is still bullish
📊 Price: above $3.00 = breakout confirmed
Key levels:
Resistance:
1. $3.0179 = recent high
2. $3.0242 = next resistance
3. $3.0842 = 24h high
Support:
1. $3.00 = psychological level
2. $2.9891 = broken channel ceiling
3. $2.9875 = SuperTrend
Holding above $3.00 = the way is clear to $3.0242, then $3.0842.
There is a chance of an explosive move upward, based on the reading.
This is not financial advice, but rather my personal analysis.
Good luck to everyone, God willing.
$LIT
#LIT
#Crypto
#Binance
#LITUSDT
1
30
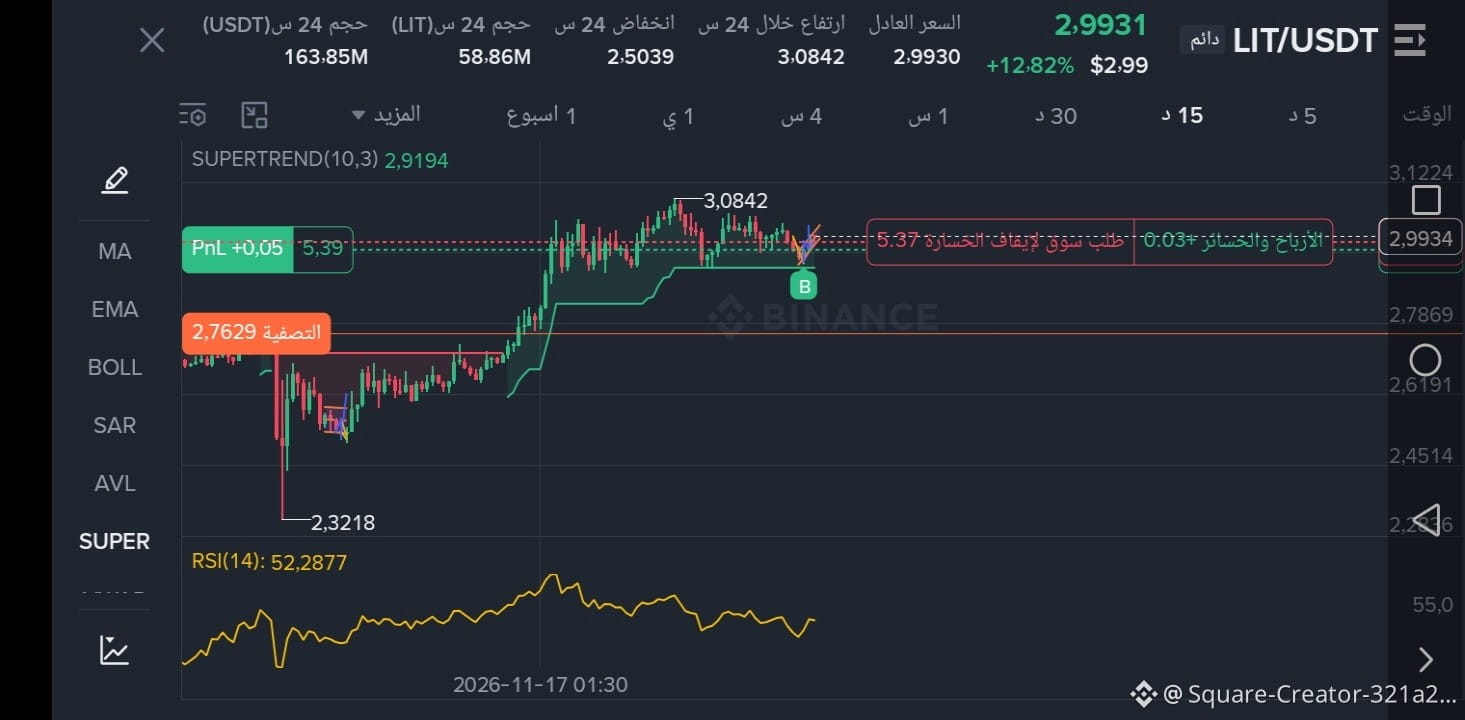
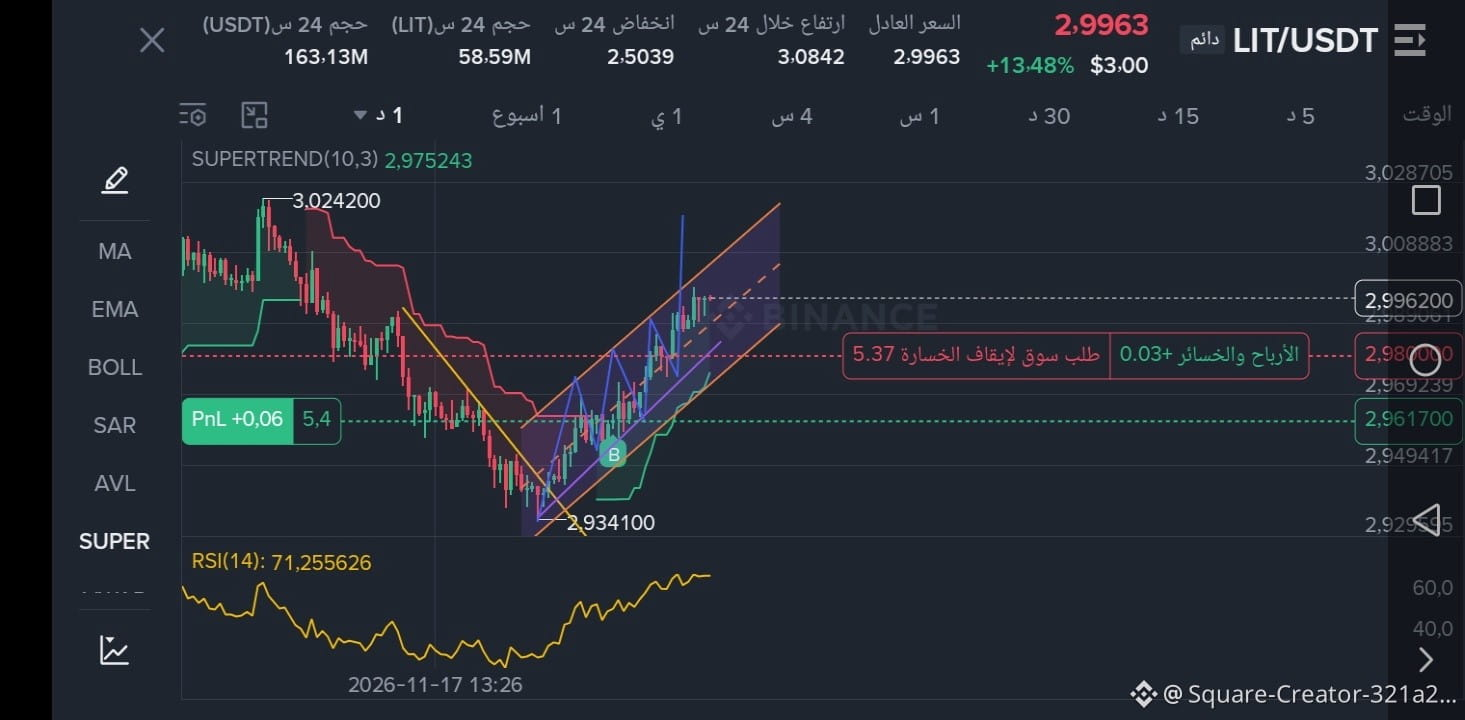
Upward move as expected
🟢Trade $LIT
Broke through the channel ceiling at 2.9891$ ✅
SuperTrend green at 2.9752$ ✅
RSI 71 = overbought
Target: 3.0242$
Stop: 2.9617$ = no loss
#Lıt
Not financial advice, just analysis
Upward move as expected
🟢Trade $LIT
Broke through the channel ceiling at 2.9891$ ✅
SuperTrend green at 2.9752$ ✅
RSI 71 = overbought
Target: 3.0242$
Stop: 2.9617$ = no loss
#Lıt
Not financial advice, just analysis
🟢Trade $LIT
Broke through the channel ceiling at 2.9891$ ✅
SuperTrend green at 2.9752$ ✅
RSI 71 = overbought
Target: 3.0242$
Stop: 2.9617$ = no loss
#Lıt
Not financial advice, just analysis
6
·
--
Bullish
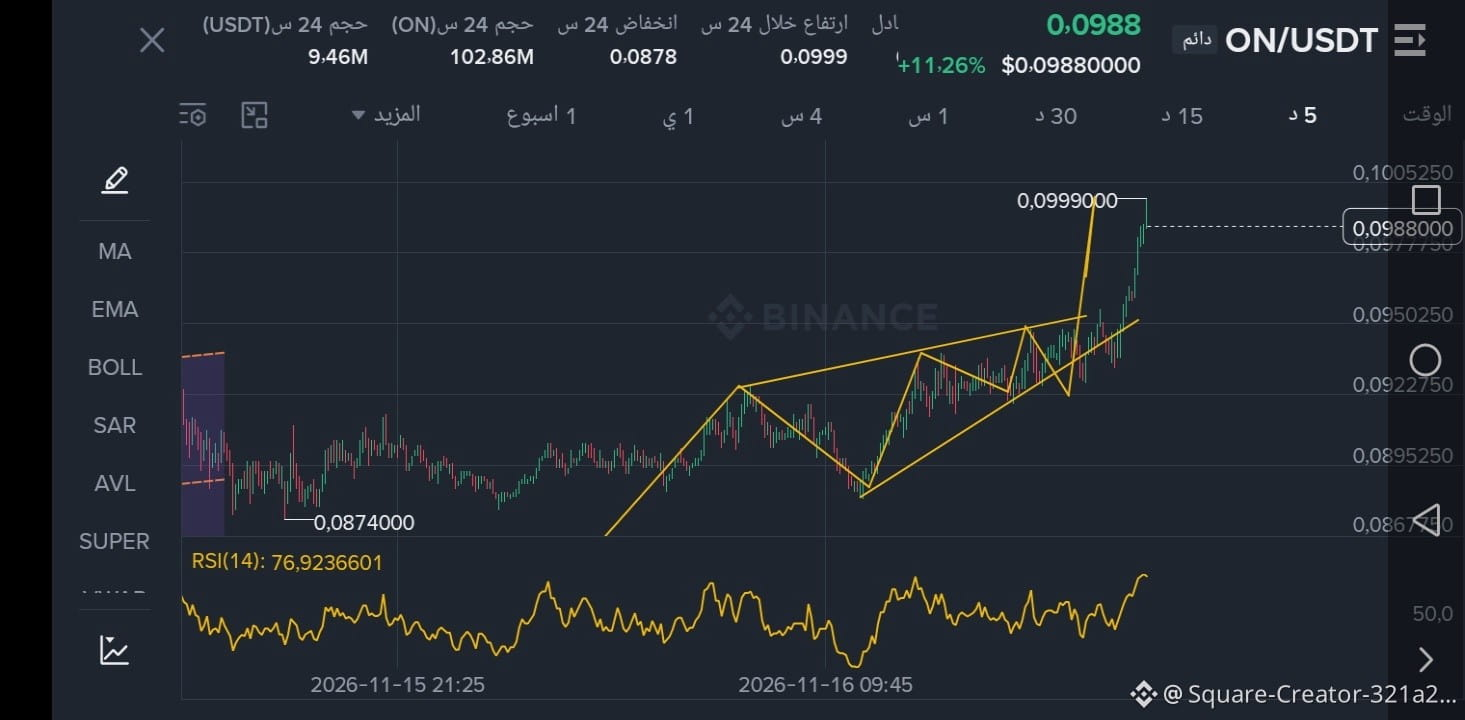
🔥🔥 $ON
{future}(ONUSDT)
It reached $0.0999 and touched $0.10 — all targets achieved
And what we expected happened.
Price now: $0.0988
Change: +11.26%
High: $0.0999
Low: $0.0878
Trading volume: $9.46M
From $0.0939 to $0.0999 = +6.4% fully achieved 🚀🚀
We said a breakout above $0.0948 would mean an explosion, and a breakout above $0.0993 would target $0.10
And it all happened
📊 RSI: 76.92 = still overbought = profit-taking is possible ⚠️
📊 Price: $0.0988 = just $0.0001 away from breaking $0.10!
📊 Pattern: Ascending triangle breakout + vertical rise
✅ Breakout above $0.10 = target $0.105 (+6%)
⛔ Profit-taking = pullback to $0.0948 (-4%) = another entry opportunity
Just analysis, and I was lucky. Not financial advice.
#Binance
#on rocket
#BR bullish
$BR
{future}(BRUSDT)
🔥🔥 $ON
It reached $0.0999 and touched $0.10 — all targets achieved
And what we expected happened.
Price now: $0.0988
Change: +11.26%
High: $0.0999
Low: $0.0878
Trading volume: $9.46M
From $0.0939 to $0.0999 = +6.4% fully achieved 🚀🚀
We said a breakout above $0.0948 would mean an explosion, and a breakout above $0.0993 would target $0.10
And it all happened
📊 RSI: 76.92 = still overbought = profit-taking is possible ⚠️
📊 Price: $0.0988 = just $0.0001 away from breaking $0.10!
📊 Pattern: Ascending triangle breakout + vertical rise
✅ Breakout above $0.10 = target $0.105 (+6%)
⛔ Profit-taking = pullback to $0.0948 (-4%) = another entry opportunity
Just analysis, and I was lucky. Not financial advice.
#Binance
#on rocket
#BR bullish
$BR
It reached $0.0999 and touched $0.10 — all targets achieved
And what we expected happened.
Price now: $0.0988
Change: +11.26%
High: $0.0999
Low: $0.0878
Trading volume: $9.46M
From $0.0939 to $0.0999 = +6.4% fully achieved 🚀🚀
We said a breakout above $0.0948 would mean an explosion, and a breakout above $0.0993 would target $0.10
And it all happened
📊 RSI: 76.92 = still overbought = profit-taking is possible ⚠️
📊 Price: $0.0988 = just $0.0001 away from breaking $0.10!
📊 Pattern: Ascending triangle breakout + vertical rise
✅ Breakout above $0.10 = target $0.105 (+6%)
⛔ Profit-taking = pullback to $0.0948 (-4%) = another entry opportunity
Just analysis, and I was lucky. Not financial advice.
#Binance
#on rocket
#BR bullish
$BR
1
23
·
--
Bullish
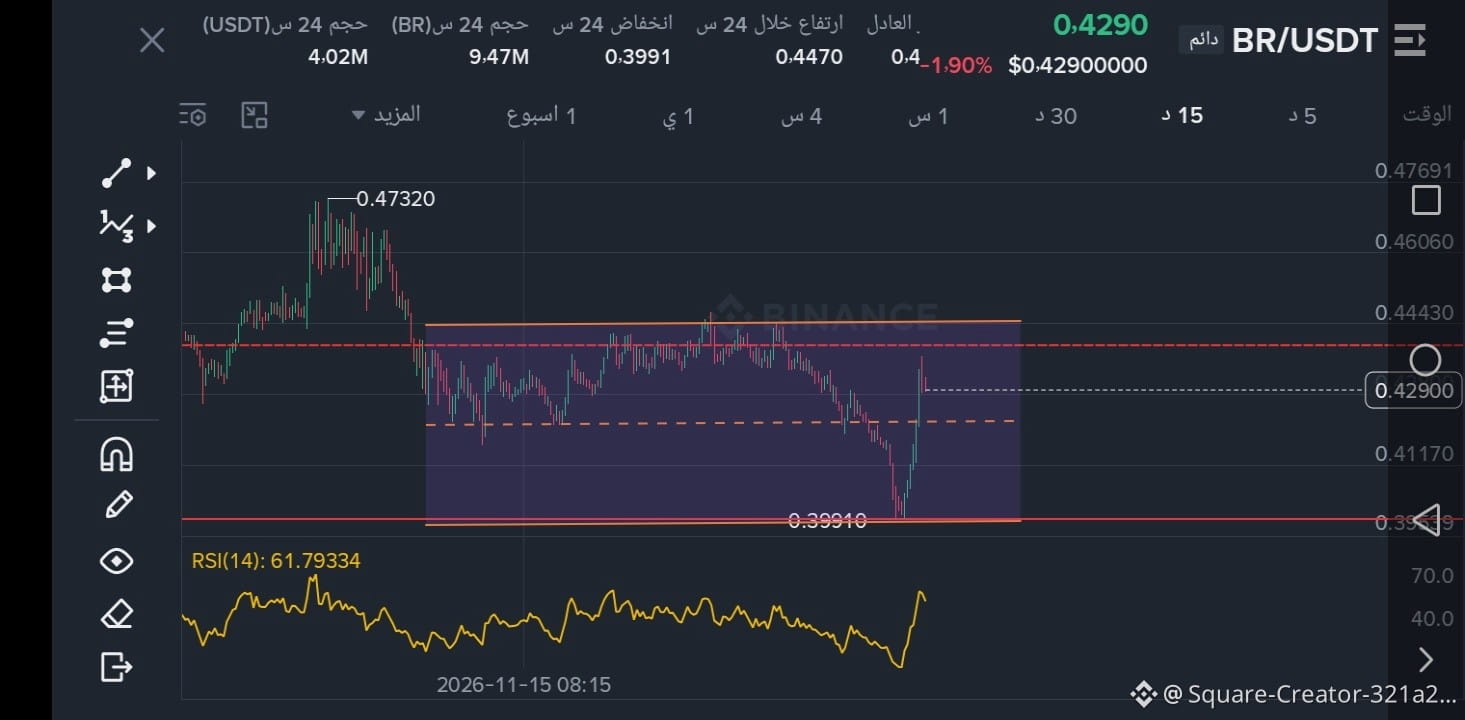
🔥 $BR
{future}(BRUSDT)
Strong rebound from the bottom of the box + RSI rose to 61
Current price: 0.4290$
Change: -1.90%
High: 0.4470$
Low: 0.3991$
Trading volume: 4.02M$
From 0.47320$ it dropped and entered a range from 0.3991$ to 0.4443$
Touched the low of 0.3991$ and rebounded +7.5% in one candle 🚀
📊 RSI: 61.79 = rose from 30 to 61 vertically = buyers entered strongly
📊 Price: 0.4290$ = in the middle of the range, after a strong rebound
📊 Pattern: sideways range + rebound from the bottom
✅ Break above 0.4443$ = target 0.47320$ (+10%)
⛔ Break below 0.4117$ = return to 0.3991$ (-6%)
#BR
#OP watching, rising from the bottom
Analysis only, good luck.
#fil watching, rising from the bottom
#Crypto
#w watching, rising from the bottom.
$OP
{future}(OPUSDT)
$FIL
{future}(FILUSDT)
Good luck to everyone, God willing
🔥 $BR
Strong rebound from the bottom of the box + RSI rose to 61
Current price: 0.4290$
Change: -1.90%
High: 0.4470$
Low: 0.3991$
Trading volume: 4.02M$
From 0.47320$ it dropped and entered a range from 0.3991$ to 0.4443$
Touched the low of 0.3991$ and rebounded +7.5% in one candle 🚀
📊 RSI: 61.79 = rose from 30 to 61 vertically = buyers entered strongly
📊 Price: 0.4290$ = in the middle of the range, after a strong rebound
📊 Pattern: sideways range + rebound from the bottom
✅ Break above 0.4443$ = target 0.47320$ (+10%)
⛔ Break below 0.4117$ = return to 0.3991$ (-6%)
#BR
#OP watching, rising from the bottom
Analysis only, good luck.
#fil watching, rising from the bottom
#Crypto
#w watching, rising from the bottom.
$OP
$FIL
Good luck to everyone, God willing
Strong rebound from the bottom of the box + RSI rose to 61
Current price: 0.4290$
Change: -1.90%
High: 0.4470$
Low: 0.3991$
Trading volume: 4.02M$
From 0.47320$ it dropped and entered a range from 0.3991$ to 0.4443$
Touched the low of 0.3991$ and rebounded +7.5% in one candle 🚀
📊 RSI: 61.79 = rose from 30 to 61 vertically = buyers entered strongly
📊 Price: 0.4290$ = in the middle of the range, after a strong rebound
📊 Pattern: sideways range + rebound from the bottom
✅ Break above 0.4443$ = target 0.47320$ (+10%)
⛔ Break below 0.4117$ = return to 0.3991$ (-6%)
#BR
#OP watching, rising from the bottom
Analysis only, good luck.
#fil watching, rising from the bottom
#Crypto
#w watching, rising from the bottom.
$OP
$FIL
Good luck to everyone, God willing
23
·
--
Bullish
As expected..
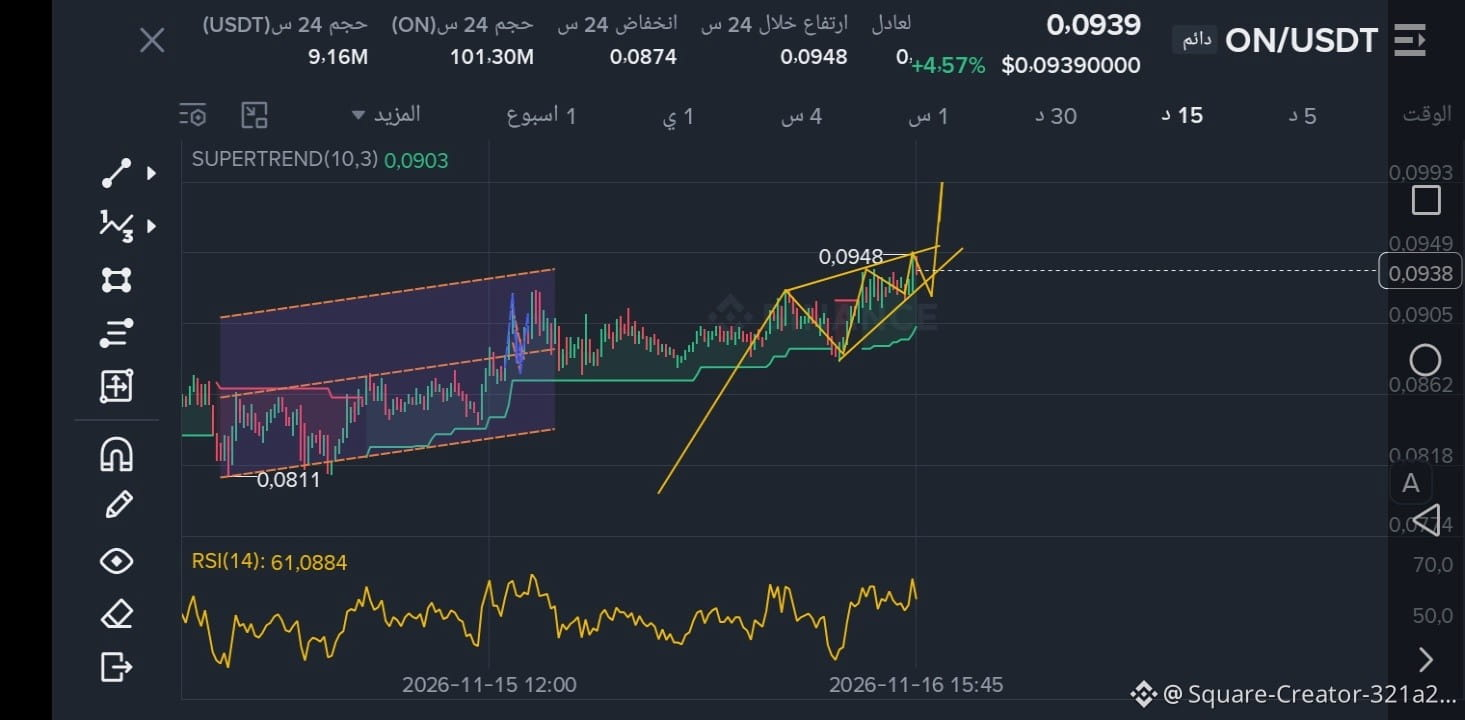
🔥 $ON
{future}(ONUSDT)
is pushing toward the peak, and a breakout is getting closer
Current price: $0.0939
Change: +4.57%
Peak: $0.0948
Low: $0.0874
Trading volume: $9.16M
From $0.0811 to $0.0948 = up +16.9% 🚀
Now inside an ascending triangle, pressing against resistance
📊 SuperTrend: $0.0903 green = uptrend 🟢
📊 RSI: 61.08 = above 60 = buyers are firmly in control 🔥
📊 Price: just $0.0009 below the peak
✅ Break above $0.0948 = target $0.0993 (+5.7%), then $0.10 (+6.5%)
⛔ Break below $0.0903 = drop to $0.0874 (-6.9%)
A breakout could happen at any moment
This is not financial advice, just analysis.
And it's rising from the bottom, God willing
#on
#ON
#Crypto
As expected..
🔥 $ON
is pushing toward the peak, and a breakout is getting closer
Current price: $0.0939
Change: +4.57%
Peak: $0.0948
Low: $0.0874
Trading volume: $9.16M
From $0.0811 to $0.0948 = up +16.9% 🚀
Now inside an ascending triangle, pressing against resistance
📊 SuperTrend: $0.0903 green = uptrend 🟢
📊 RSI: 61.08 = above 60 = buyers are firmly in control 🔥
📊 Price: just $0.0009 below the peak
✅ Break above $0.0948 = target $0.0993 (+5.7%), then $0.10 (+6.5%)
⛔ Break below $0.0903 = drop to $0.0874 (-6.9%)
A breakout could happen at any moment
This is not financial advice, just analysis.
And it's rising from the bottom, God willing
#on
#ON
#Crypto
🔥 $ON
is pushing toward the peak, and a breakout is getting closer
Current price: $0.0939
Change: +4.57%
Peak: $0.0948
Low: $0.0874
Trading volume: $9.16M
From $0.0811 to $0.0948 = up +16.9% 🚀
Now inside an ascending triangle, pressing against resistance
📊 SuperTrend: $0.0903 green = uptrend 🟢
📊 RSI: 61.08 = above 60 = buyers are firmly in control 🔥
📊 Price: just $0.0009 below the peak
✅ Break above $0.0948 = target $0.0993 (+5.7%), then $0.10 (+6.5%)
⛔ Break below $0.0903 = drop to $0.0874 (-6.9%)
A breakout could happen at any moment
This is not financial advice, just analysis.
And it's rising from the bottom, God willing
#on
#ON
#Crypto
Abo-Khalid-Dobal
·
--
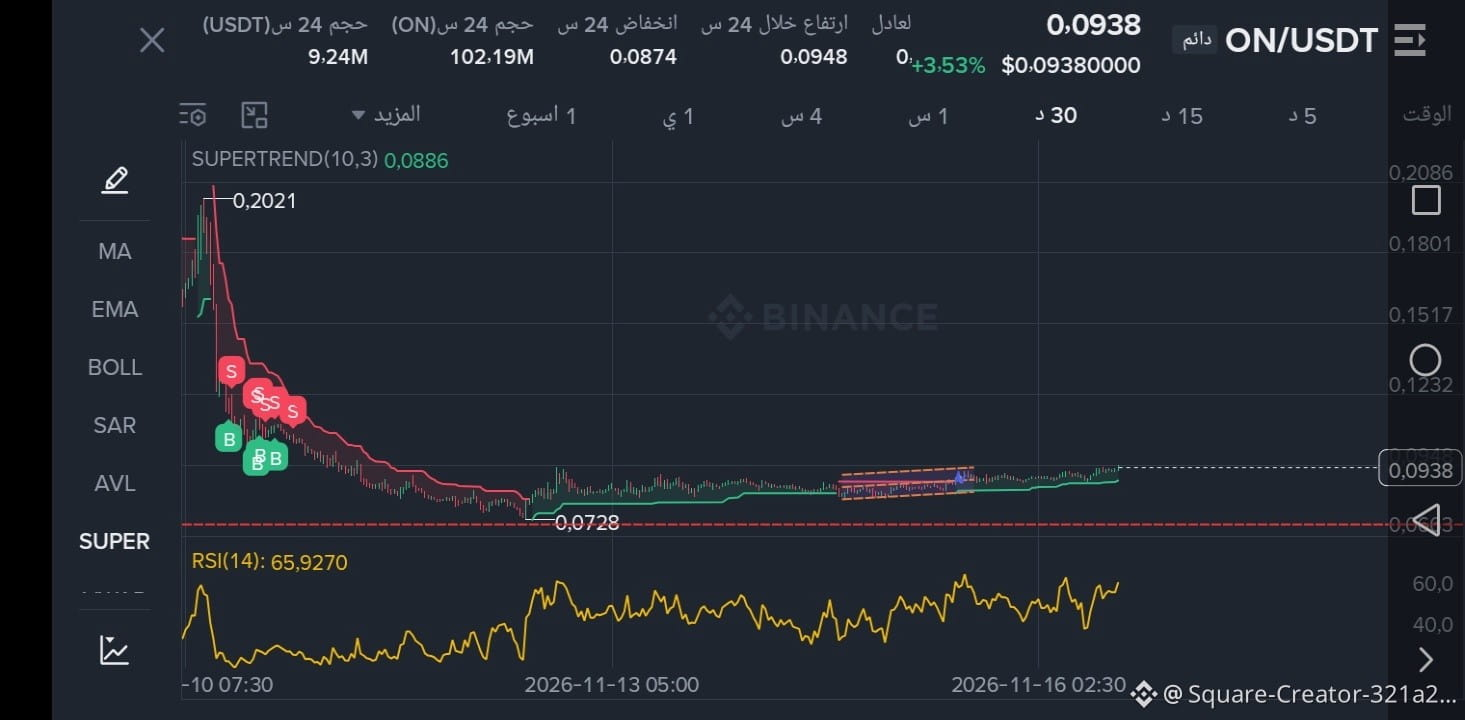
BullishThe ascending wedge formation is currently within the accumulation channel, which formed as a bullish flag pattern.
#on
$ON
#on
$ON
1
134
Log in to explore more content
Join global crypto users on Binance Square
⚡️ Get latest and useful information about crypto.
💬 Trusted by the world’s largest crypto exchange.
👍 Discover real insights from verified creators.
Email / Phone number
Trending Topics
MoreHikesExpectedIsBTCUnderPressure
7,261 views
106 Discussing
FOMC Minutes | Fed Minutes Show Almost All Officials Expect More Rate Hikes, With Some Open to a Larger December Move
Binance News
·15 Likes
·21.1k views
NvidiaBeatsEstimatesWith$130BQ4Outlook
73,057 views
299 Discussing
AnthropicIPOPriceCouldExceed$80
71,895 views
249 Discussing