Inflation concerns and the U.S. debt impasse have cast a shadow over Bitcoin’s fading bullish outlook.
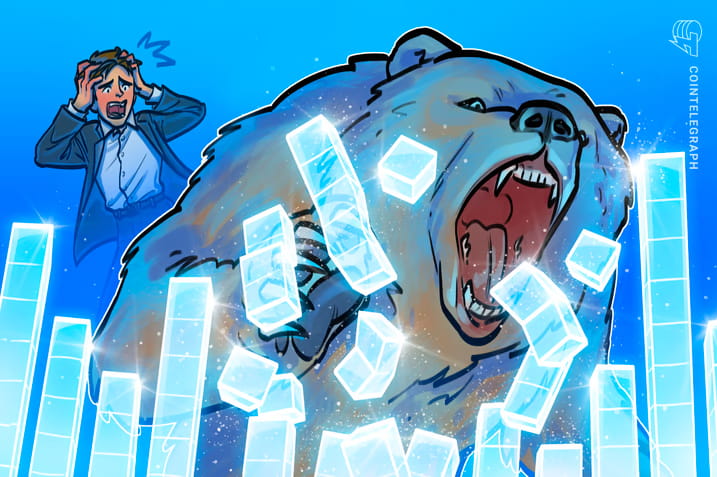
Bearish technical formations have weighed on the total cryptocurrency market cap over the past seven weeks.
Bitcoin $26,419
Down 2% — BNB down 1.7% and 2.5%
BNB $303 and Ripple $0.46 were the main drivers of the latest 1.3% correction between May 18 and May 25, respectively.
The falling wedge that started in April suggests a possible breakout above nearly $1 trillion by the end of July. For bulls, the bearish structure that pushed total market capitalization to $1.11 trillion on May 25 means an eventual breakout to the upside will require extra effort.
Sticky inflation continues to worry investors, who see a higher probability of further rate hikes from the Federal Reserve. The country’s latest measure of personal consumption expenditures showed a 5% increase, significantly above the 2% inflation target.
Furthermore, German statistics office data on May 25 showed that the country’s GDP for the first quarter of 2023 was revised down to -0.3% from the previous quarter, from 0%, the second consecutive decline. In addition, there is the upcoming US debt ceiling standoff and the fact that the US Treasury is rapidly running out of cash.
As governments aim to tighten control over crypto assets, there are also a range of regulatory risks. The latest incident involves a watchdog within the European Central Bank, called the European Systemic Risk Board (ESRB), which recommended paying special attention to the risks of stablecoins running banks. The ESRB mentioned the lack of transparency of stablecoins and provided the example of Tether.
Derivatives suggest shorts are reluctant to go short
Perpetual contracts, also known as inverse swaps, have an implicit interest rate that is typically charged every eight hours.
A positive funding rate indicates that longs (buyers) require more leverage. However, the opposite occurs when shorts (sellers) require additional leverage, causing the funding rate to turn negative.

7-day funding rates for BTC and Ether
Ether is neutral, indicating a balance of demand from leveraged longs (buyers) and shorts (sellers) using perpetual futures contracts.
To rule out outside factors that could affect the futures market alone, traders can gauge market sentiment by measuring whether there is more activity through call (buy) options or put (sell) options.
A call-put ratio of 0.70 indicates that put open interest lags the more bullish call option, and is therefore bullish. In contrast, a 1.40 indicator favors put options, which can be viewed as bearish.

The put-to-call ratio of Bitcoin options volume has remained below 1.0 over the past few weeks, indicating a preference for neutral to bullish call options. More importantly, even when Bitcoin briefly corrected to $25,900 on May 25, there was no significant spike in demand for protective put options.
Multiple factors will continue to weigh on Bitcoin prices
Given the balancing needs in the futures market, traders appear reluctant to add to their positions until there is more clarity on the US debt impasse. It is unclear whether the crypto market will be able to break out of the falling wedge.
Even if professional traders do not use derivatives to bet on catastrophic scenarios for the price of Bitcoin, the trigger for a bull run is currently lacking given the uncertainty in the macroeconomic environment. Therefore, ultimately, bears are in control as the falling wedge will see another 10% correction by July.
C3 Tip: The views, thoughts and opinions expressed here are the author's own. This article does not contain investment advice or recommendations. Every investment and transaction involves risk. There are three levels of investment: see, understand, and hold. There are also three levels of entrepreneurship: think, do, and make it. Each level seems to be not much different in words, but in fact, there is a huge difference. Each level can eliminate more than 90% of people.

