MATIC price is recovering from the $0.95 support zone. Polygon might rise further but there is a major barrier forming near the $1.080 zone.
MATIC price is attempting a recovery wave above the $1.00 resistance against the US dollar.
The price is trading below $1.10 and the 100 simple moving average (4 hours).
There was a break above a key bearish trend line with resistance near $0.975 on the 4-hour chart of the MATIC/USD pair (data source from Kraken).
The pair could continue to rise if it clears the $1.008 resistance zone.
Polygon’s MATIC Price Faces Resistance
Over the past few days, Polygon's value has experienced a steady decline from levels well above $1.12. As a result, MATIC fell below the $1.00 support level, entering a bearish zone.
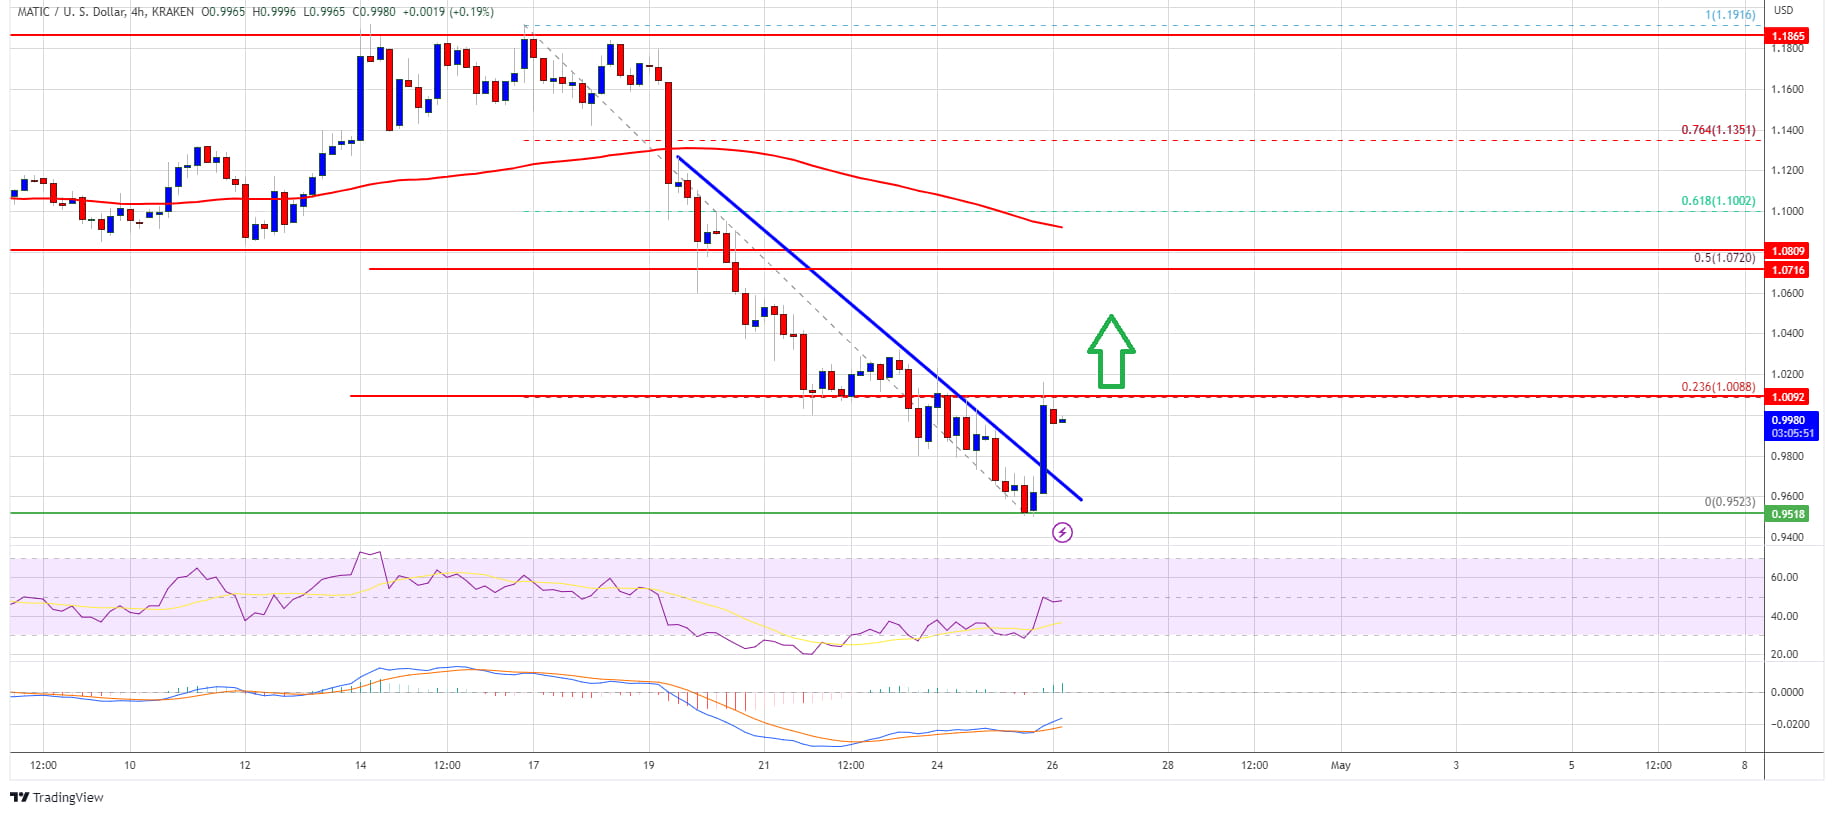
The cryptocurrency reached a low point of around $0.952, but it is now attempting to recover, similar to Bitcoin and Ethereum. The price has risen above $0.980, and a key bearish trend line with resistance near $0.975 was broken on the 4-hour chart of the MATIC/USD pair.
Despite this, the price is still trading below $1.10 and the 100 simple moving average (4 hours). It is currently facing resistance near the $1.008 level, which is the 23.6% Fib retracement level of the downward move from the $1.191 swing high to the $0.952 low.
If the price breaks above the $1.008 resistance level, it may continue to recover. The next significant resistance level is around $1.08, which is the 50% Fib retracement level of the downward move from the $1.191 swing high to the $0.952 low.
If the price of MATIC can break the resistance level at $1.08, it may initiate a sustained upward movement. In this scenario, the price could even aim for the $1.15 or $1.20 levels.
More Losses in MATIC?
In case the MATIC price is unable to break above the $1.008 resistance level, it may initiate a new downtrend. The immediate support on the downside is positioned near the $0.98 level, while the main support is near the $0.95 level. If the price goes below the $0.95 level, it may lead to a fresh decline towards the $0.88 level, with the next significant support level near $0.82.
Looking at the 4-hour chart, the MACD indicator for MATIC/USD is gaining momentum in the bullish zone. The RSI (Relative Strength Index) is now close to the 50 level, indicating that the price is currently consolidating.
The significant resistance levels are $1.008, $1.08, and $1.12, while the major support levels are $0.98 and $0.95. If the price breaks above the $1.08 resistance level, it could lead to a steady increase, with the price potentially attempting to reach the $1.15 or $1.20 level.
#polygon #matic #analysis #dyor #marketupdate
Source: newsbtc
If you enjoy our content and want to show your support, please like, share, and follow us for more high-quality updates.
Disclaimer
The views and opinions expressed by the author, or any people mentioned in this article, are for informational purposes only, and they do not constitute financial, investment, or other advice. Investing in or trading crypto assets comes with a risk of financial loss.


