BTC rebounds to 57.8k after sweeping 55.1k: can it hold?
BTC is at 57,821 USD, down 6.4% in 24 hours, after falling from a high of 62,320 to a low of 55,126. The Fear & Greed Index is at 12, in the extreme fear zone. According to a CoinGlass report, around 2.4 billion USD worth of positions were liquidated today.
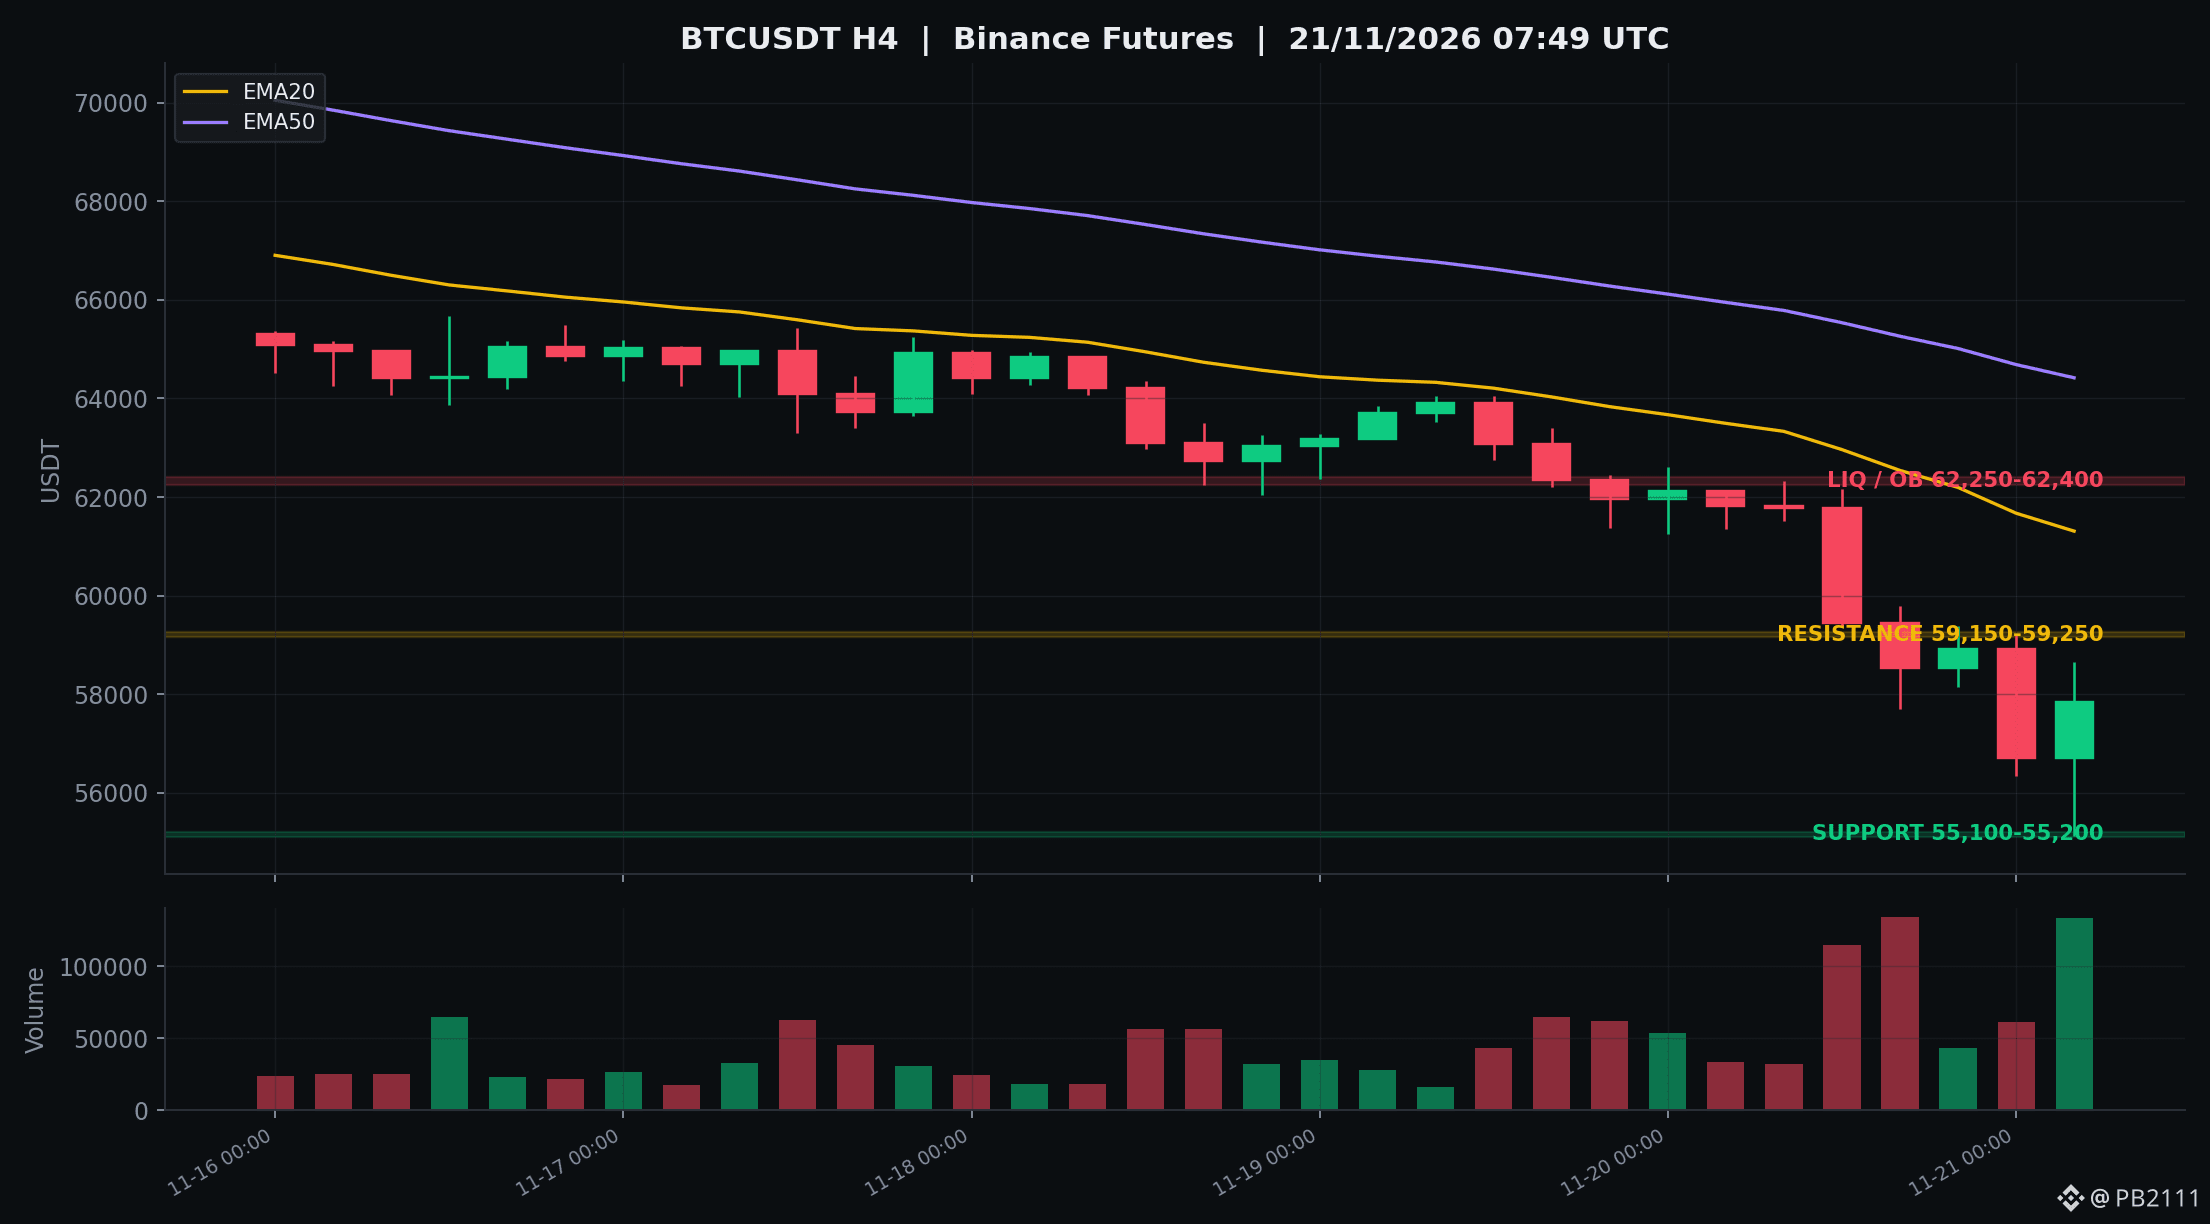
The BTC H4 chart shows the 62k range breaking on heavy volume, followed by the morning candle on 21/11 sweeping 55,126 before bouncing back. The 55,100–55,200 zone is the nearest support, as it marks the 24-hour low and the area where longs were stopped out. Resistance is near 59,150–59,250, the price zone where selling occurred before the drop. Greater liquidity lies at 62,250–62,400. BTC funding is +0.0015% every 8h, close to neutral. OI is still at 94,291 BTC, meaning positions have not been fully cleared out.
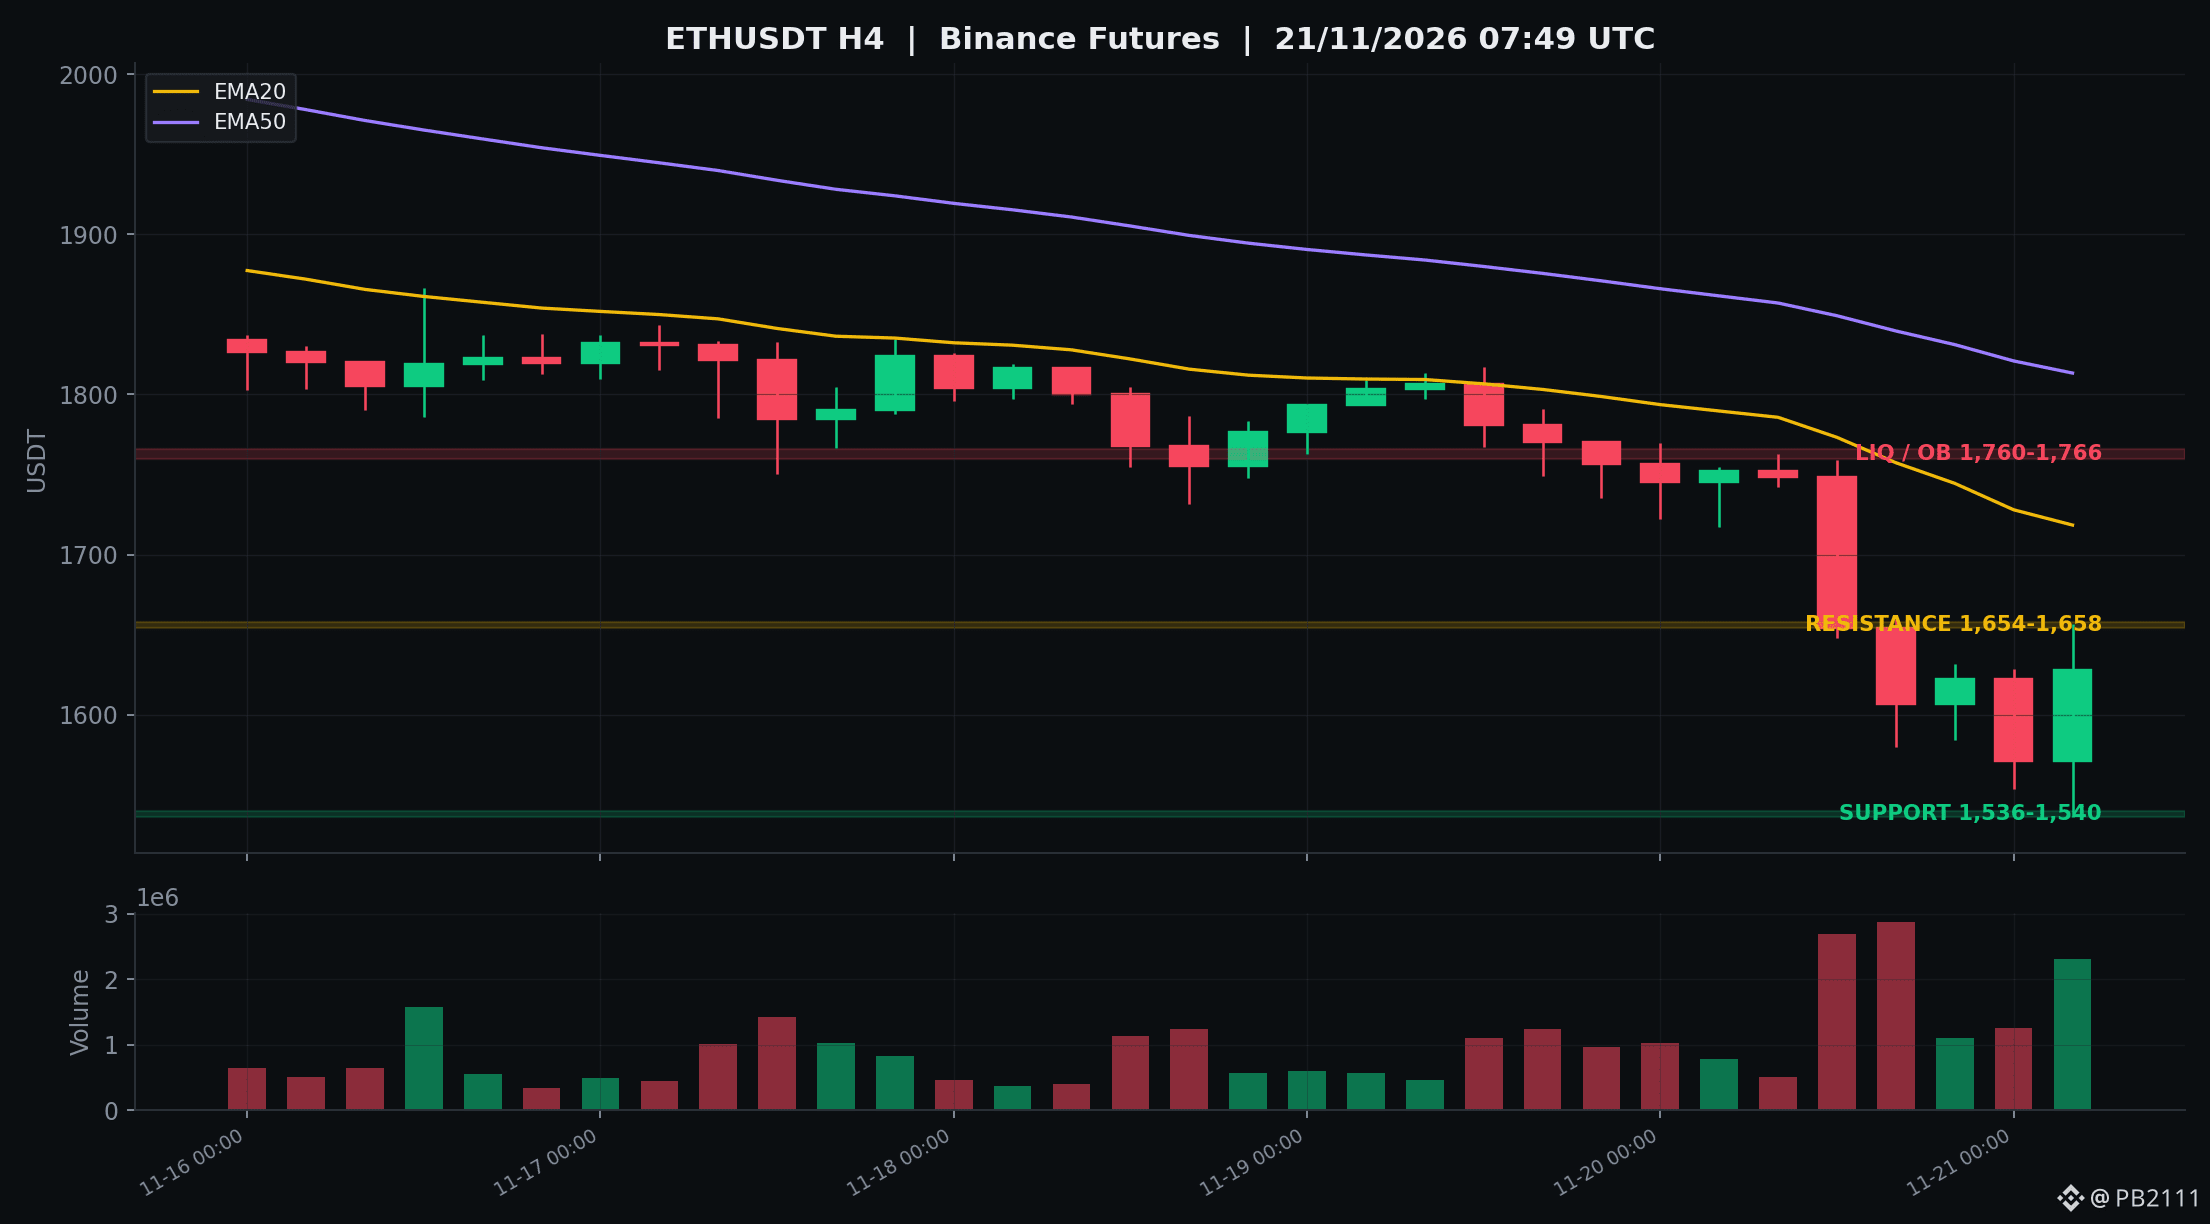
ETH is down 6.9% to 1,627 USD. Support is at 1,536–1,540, resistance at 1,654–1,658, and liquidity above at 1,760–1,766. Funding is -0.0037%/8h, so shorts are paying a small fee. OI is 2.31 million ETH.
Attach an H4 BTCUSDT chart with the 55,100–55,200, 59,150–59,250, and 62,250–62,400 zones marked, along with EMA20, EMA50, and volume. For ETH, use an H4 chart marking 1,536–1,540 and 1,654–1,658.
If 55.1k holds → a rebound to test 59.1k. If 55.1k breaks → watch 50,000 as a psychological level. If ETH breaks below 1,536, its recovery structure will weaken.
This is still a technical reaction after a sell-off, not confirmation of a bottom. Funding is neutral and OI remains high, so a retest cannot be ruled out.
$BTC $ETH #Bitcoin #Crypto #MarketAnalysis
Are you watching 55.1k or 59.1k today?
BTC is at 57,821 USD, down 6.4% in 24 hours, after falling from a high of 62,320 to a low of 55,126. The Fear & Greed Index is at 12, in the extreme fear zone. According to a CoinGlass report, around 2.4 billion USD worth of positions were liquidated today.
The BTC H4 chart shows the 62k range breaking on heavy volume, followed by the morning candle on 21/11 sweeping 55,126 before bouncing back. The 55,100–55,200 zone is the nearest support, as it marks the 24-hour low and the area where longs were stopped out. Resistance is near 59,150–59,250, the price zone where selling occurred before the drop. Greater liquidity lies at 62,250–62,400. BTC funding is +0.0015% every 8h, close to neutral. OI is still at 94,291 BTC, meaning positions have not been fully cleared out.
ETH is down 6.9% to 1,627 USD. Support is at 1,536–1,540, resistance at 1,654–1,658, and liquidity above at 1,760–1,766. Funding is -0.0037%/8h, so shorts are paying a small fee. OI is 2.31 million ETH.
Attach an H4 BTCUSDT chart with the 55,100–55,200, 59,150–59,250, and 62,250–62,400 zones marked, along with EMA20, EMA50, and volume. For ETH, use an H4 chart marking 1,536–1,540 and 1,654–1,658.
If 55.1k holds → a rebound to test 59.1k. If 55.1k breaks → watch 50,000 as a psychological level. If ETH breaks below 1,536, its recovery structure will weaken.
This is still a technical reaction after a sell-off, not confirmation of a bottom. Funding is neutral and OI remains high, so a retest cannot be ruled out.
$BTC $ETH #Bitcoin #Crypto #MarketAnalysis
Are you watching 55.1k or 59.1k today?