🚨 $BTC IS FALLING HALFWAY FROM THE 126K PEAK TO THE 34K BOTTOM, AND HISTORY HAS ALREADY WRITTEN THE PRICE OF HESITATION
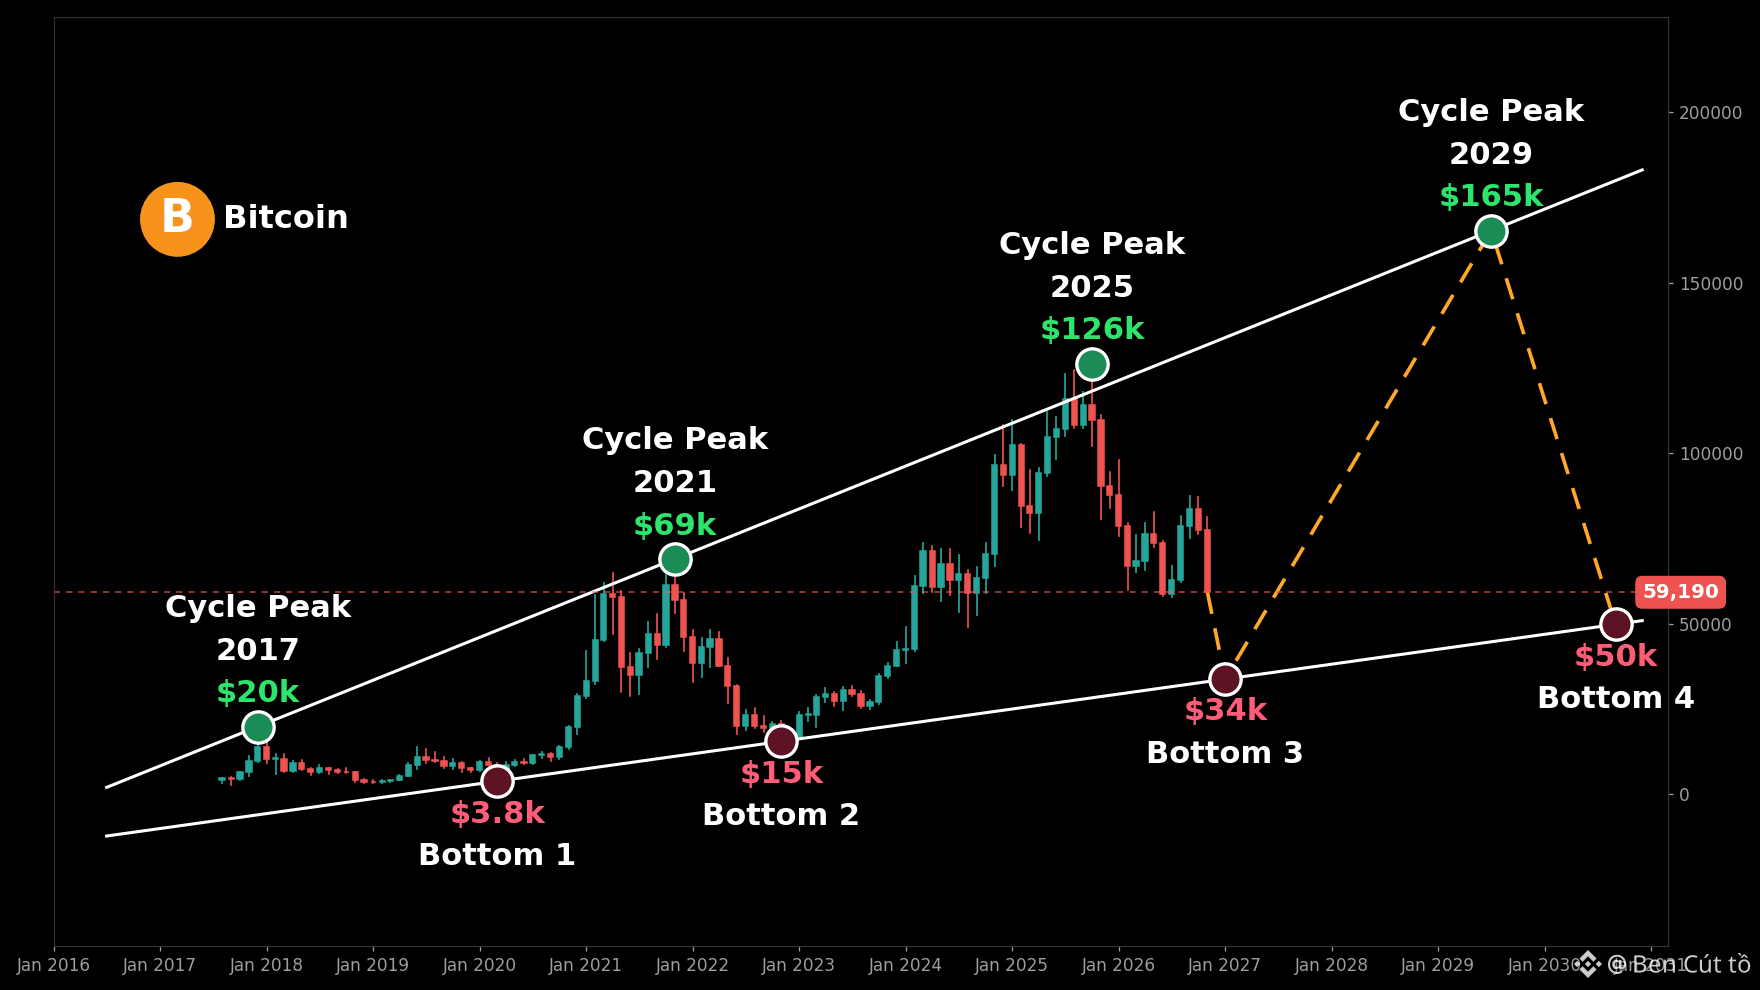
The resistance line connecting $BTC 's three cycle peaks has never been off. The 2017 peak at 20K USD, the 2021 peak at 69K USD, and the 2025 peak at 126K USD all landed exactly on the same line, extended over nearly 10 years. The current price of 59,190 USD has fallen 53% from the 126K USD peak, meaning it is now halfway through the cycle's downward move.
The support line connecting the lows is just as clear. The 2020 low at 3,782 USD and the 2022 low at 15,476 USD both landed on the same line. Extend this line, and the next cycle bottom comes in around 34K USD in 2027, followed by the next bottom near 50K USD in 2030. The next cycle peak, based on the resistance line, comes in around 165K USD in 2029.
History repeats itself in measurable ways. Twelve months after the 2021 peak, $BTC fell 69.9%. Twelve months after the 2022 bottom, $BTC rose 119.8%. Anyone who stayed out at the 2022 bottom watched the price more than double in just one year, while anyone who bought at the 2021 peak lost nearly 70% in that same period. This time, the price is midway—not at the peak, but not yet at the bottom.
The invalidation level is very clear: if $BTC closes a week below 34K USD, this cycle-bottom scenario is broken and the map must be redrawn. Set a price alert at 34K USD—don't wait for the market to remind you.
Where are you on this map, near the 126K USD peak or near the 34K USD bottom?
Save this chart and follow along so you don't miss $BTC 's next move.
The resistance line connecting $BTC 's three cycle peaks has never been off. The 2017 peak at 20K USD, the 2021 peak at 69K USD, and the 2025 peak at 126K USD all landed exactly on the same line, extended over nearly 10 years. The current price of 59,190 USD has fallen 53% from the 126K USD peak, meaning it is now halfway through the cycle's downward move.
The support line connecting the lows is just as clear. The 2020 low at 3,782 USD and the 2022 low at 15,476 USD both landed on the same line. Extend this line, and the next cycle bottom comes in around 34K USD in 2027, followed by the next bottom near 50K USD in 2030. The next cycle peak, based on the resistance line, comes in around 165K USD in 2029.
History repeats itself in measurable ways. Twelve months after the 2021 peak, $BTC fell 69.9%. Twelve months after the 2022 bottom, $BTC rose 119.8%. Anyone who stayed out at the 2022 bottom watched the price more than double in just one year, while anyone who bought at the 2021 peak lost nearly 70% in that same period. This time, the price is midway—not at the peak, but not yet at the bottom.
The invalidation level is very clear: if $BTC closes a week below 34K USD, this cycle-bottom scenario is broken and the map must be redrawn. Set a price alert at 34K USD—don't wait for the market to remind you.
Where are you on this map, near the 126K USD peak or near the 34K USD bottom?
Save this chart and follow along so you don't miss $BTC 's next move.