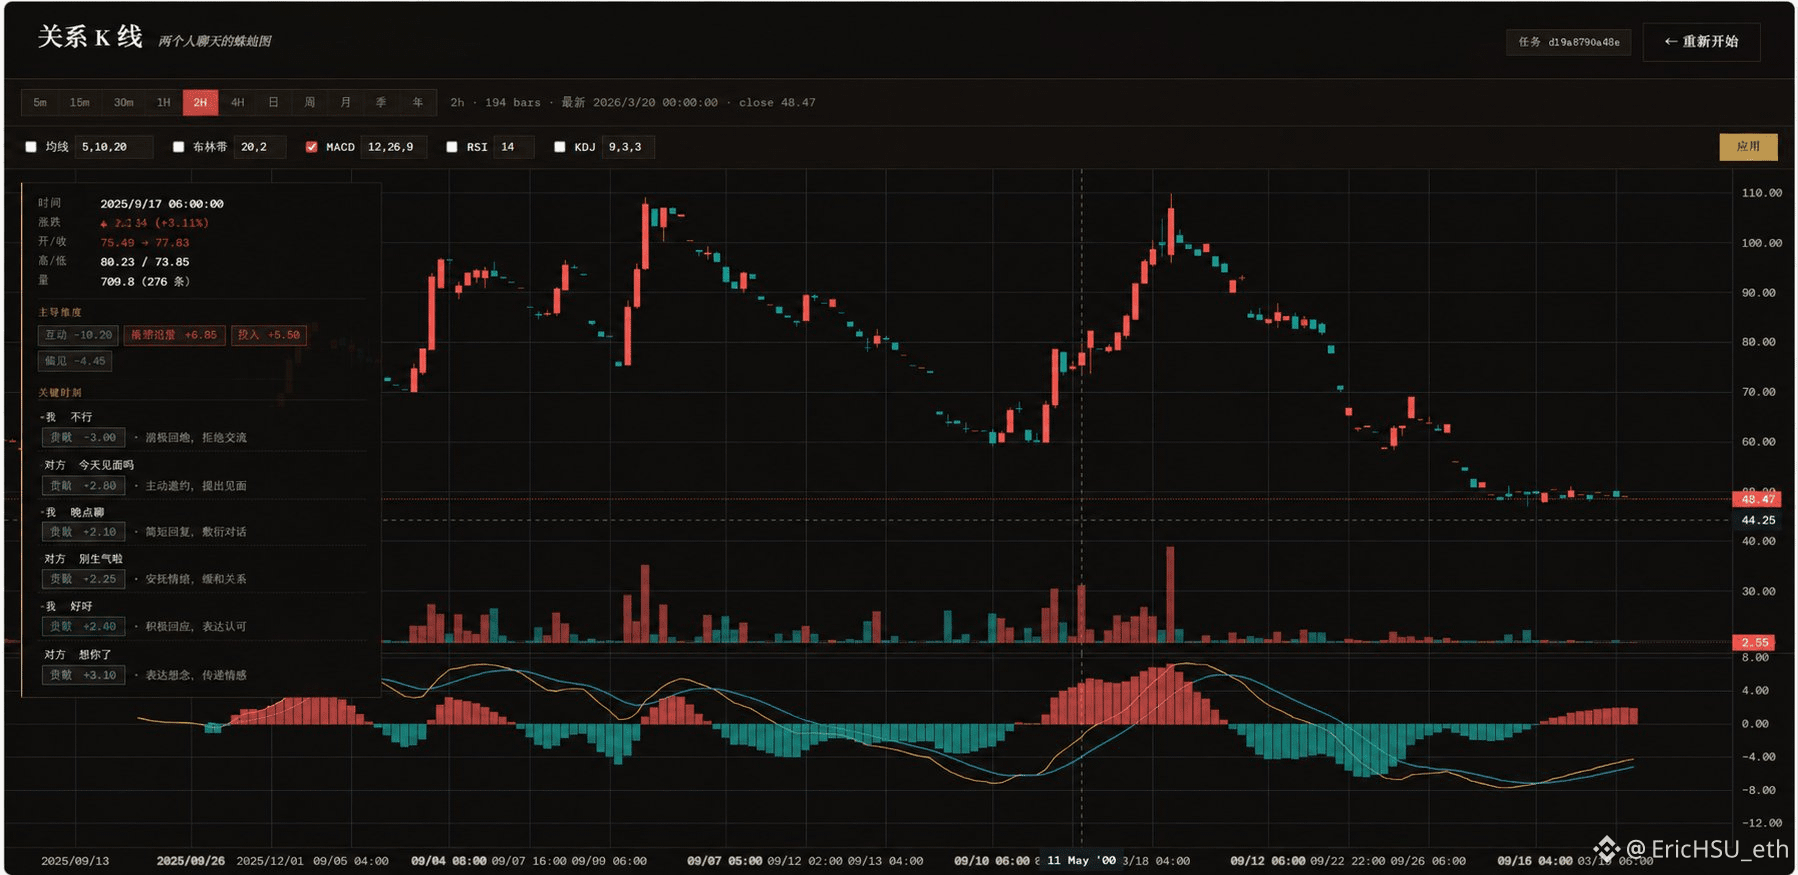
GM☕️ The market’s been dropping so much lately that I don’t even want to look at candlestick charts anymore 🫠. But today, while browsing around, I stumbled across a fun kind of “candlestick chart.” Someone turned chat relationships into candlestick charts 😂
How it works: Import two people’s WeChat chat history, and AI will look at whether their relationship has improved or cooled off compared with their previous conversations, then plot it as 5-minute, daily, and weekly charts. It even includes trading volume: how many messages were sent, how many characters were typed, whether someone replied instantly—all used as reference data.
The most sensible part, I think, is that the code applies a default penalty to one-character replies (my wife has snapped at me before for replying with just “嗯” [“Mm”]—at the very least, it should be “嗯嗯” [“Mm-hmm”] 😂). If you dare send a quick, one-character reply, the chart immediately plunges on huge volume 🤡.
Project on GitHub: relationship-candlestick-lab
How it works: Import two people’s WeChat chat history, and AI will look at whether their relationship has improved or cooled off compared with their previous conversations, then plot it as 5-minute, daily, and weekly charts. It even includes trading volume: how many messages were sent, how many characters were typed, whether someone replied instantly—all used as reference data.
The most sensible part, I think, is that the code applies a default penalty to one-character replies (my wife has snapped at me before for replying with just “嗯” [“Mm”]—at the very least, it should be “嗯嗯” [“Mm-hmm”] 😂). If you dare send a quick, one-character reply, the chart immediately plunges on huge volume 🤡.
Project on GitHub: relationship-candlestick-lab