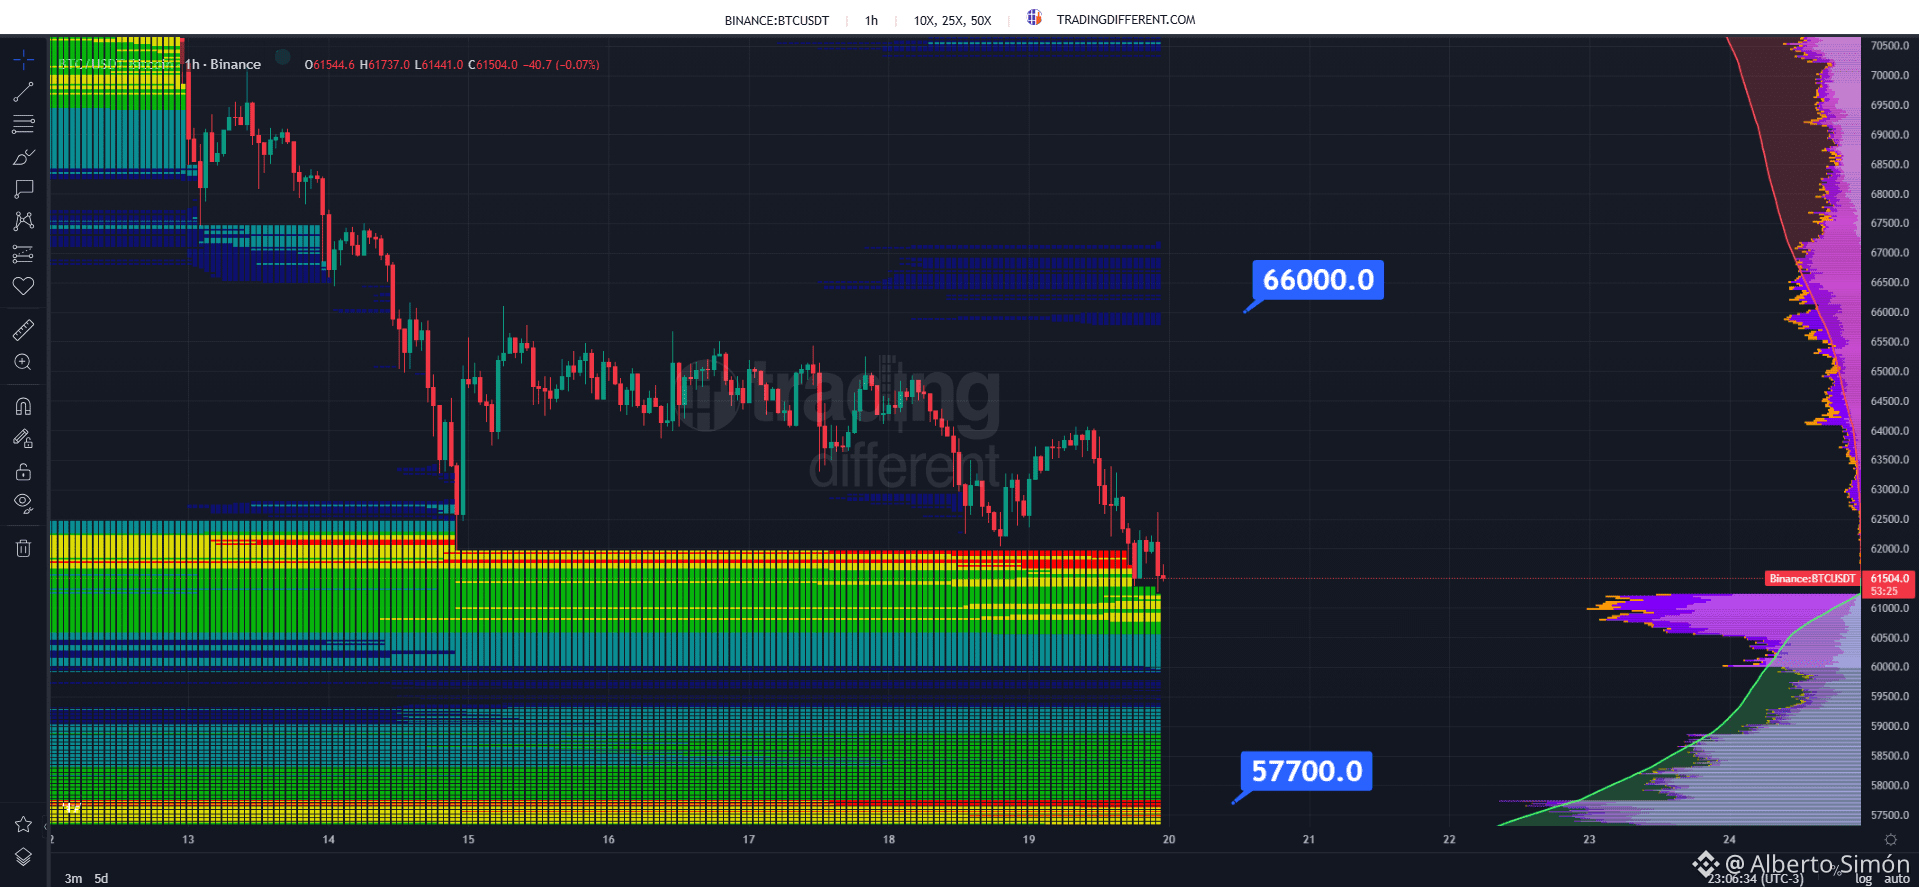
$BTC on the 1h chart 📊
Bitcoin is now inside the zone with the most accumulated liquidity in recent weeks.
After moving sideways for several days, today’s bounce failed to surpass previous highs, and the price fell sharply again. This time, it didn’t stop at the edge: it’s already consuming the upper part of the block that had been supporting it.
That detail matters. While the price was holding above it, the block acted as support. Now that the price is moving through it, each swept section leaves less liquidity between the price and the lower part of the zone. ⚖️📉
From here, two paths are possible:
🧲 If the price continues moving through the block without reacting, $57,700 would become the target at the lower end of all that liquidity.
🚀 If a strong reaction appears in this zone, it would signal that liquidity is slowing the drop. Even so, for the price to reach $66,000, it would first need to reclaim the range it traded in for most of the week.
For now, selling pressure is in control. The key is how the price responds within this block. 👀
#BTC #Bitcoin #BTCUSDT #Crypto #Liquidity #MarketStructure #PriceAction #CryptoTraders
Bitcoin is now inside the zone with the most accumulated liquidity in recent weeks.
After moving sideways for several days, today’s bounce failed to surpass previous highs, and the price fell sharply again. This time, it didn’t stop at the edge: it’s already consuming the upper part of the block that had been supporting it.
That detail matters. While the price was holding above it, the block acted as support. Now that the price is moving through it, each swept section leaves less liquidity between the price and the lower part of the zone. ⚖️📉
From here, two paths are possible:
🧲 If the price continues moving through the block without reacting, $57,700 would become the target at the lower end of all that liquidity.
🚀 If a strong reaction appears in this zone, it would signal that liquidity is slowing the drop. Even so, for the price to reach $66,000, it would first need to reclaim the range it traded in for most of the week.
For now, selling pressure is in control. The key is how the price responds within this block. 👀
#BTC #Bitcoin #BTCUSDT #Crypto #Liquidity #MarketStructure #PriceAction #CryptoTraders