Early Friday, with the US session nearing its close, Nasdaq futures had already slid about 3.8% from the session high and were hovering near the session low. Some are treating assets that were nearly flat during the day, with inverted funding paying subsidies far above the usual cap, as proof that this selloff is over—and that they can call it a day once the market closes. The numbers tell a different story: one was nearly flat, with inverted funding paying an outsized subsidy; the long share was still pinned at about 59%, positions had barely been reduced, the drawdown was still about 15%, and it was still in the weekly hole. The other saw its L1 long share ease slightly from about 60% to 59%; it too had inverted funding paying an outsized subsidy, sold off during the day, and saw barely any change in contract count.
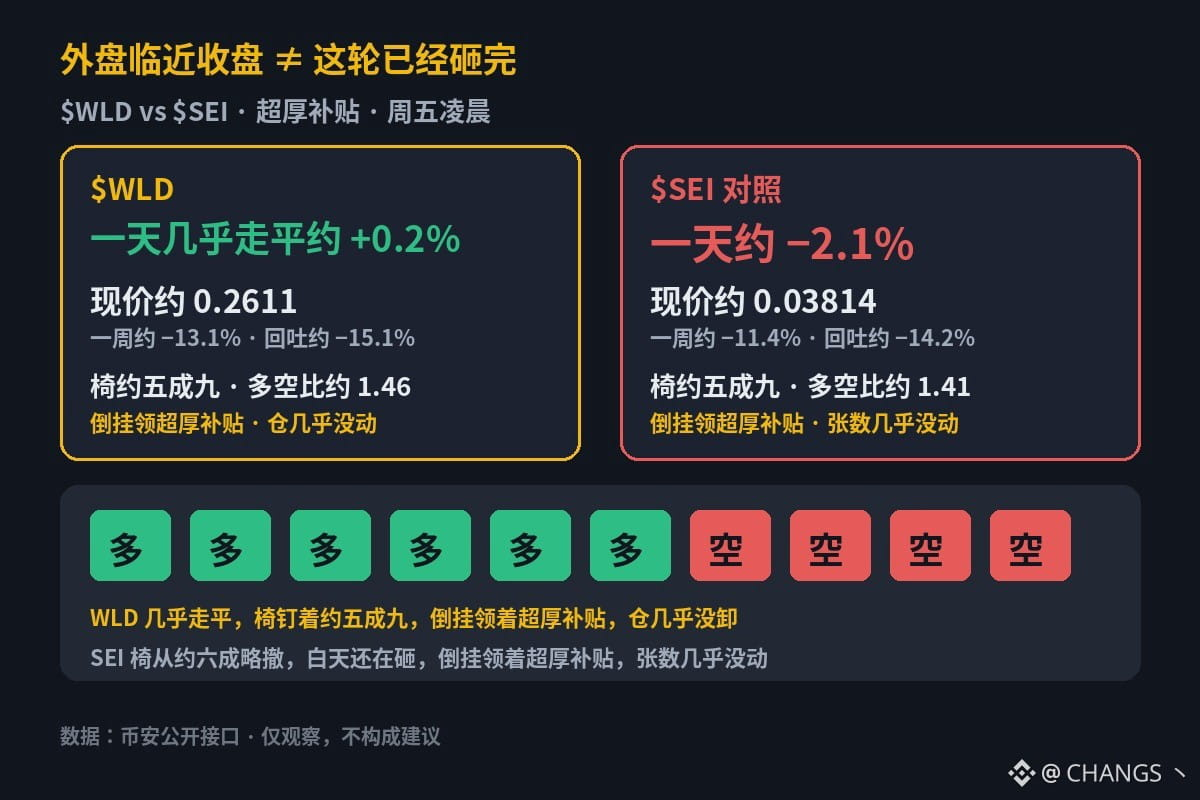
$WLD: Nearly flat on the day at about +0.2%; down about −13.1% over the week. Current price: about 0.2611. Weekly high: about 0.3075; drawdown: about −15.1%. Account long/short ratio: about 1.46 (about 59% long; around a day ago it was about 1.48/60%, so the long share has barely moved). Funding is inverted at about −0.0204%/8h, paying an outsized subsidy far beyond the usual cap. OI contract count over the past day: about −1.1% (about −0.5% in USD terms; positions have barely changed). Price has slid from the intraday high of about 0.2688 and remains not far from the intraday low of about 0.255; it is still in the weekly hole. The long share is pinned at about 59% and has barely moved, inverted funding is paying an outsized subsidy, and positions have barely been reduced—don’t take 0.2611 being nearly flat, with inverted funding paying a subsidy far beyond the usual cap, as proof that this selloff is over. And don’t take the US session nearing its close with price near the intraday low as a signal that you can call it a day.
In the same session, $SEI was down about −2.1% over the day and about −11.4% over the week. Current price: about 0.03814. Weekly high: about 0.04444; drawdown: about −14.2%. Long share: about 59% (long/short ratio about 1.41; around a day ago it was about 1.50/60%, so longs are backing off). Funding is inverted at about −0.0197%/8h, paying an outsized subsidy far beyond the usual cap. OI over the past day: about +0.6% (about −1.0% in USD terms, mostly due to the price drop; contract count has barely changed). Price has slid from the intraday high of about 0.03942 and is near the intraday low of about 0.03742; it is still in the weekly hole. The long share has eased from about 60% to 59%, inverted funding is paying an outsized subsidy, and the position count has barely been reduced.
One was nearly flat during the day, with inverted funding paying an outsized subsidy; the long share was still pinned at about 59%, positions had barely been reduced, and it was still in the weekly hole. The other saw its L1 long share ease slightly from about 60% to 59%, sold off about 2% during the day, also had inverted funding paying an outsized subsidy, and saw barely any change in contract count. Does this mean that with the US session nearing its close and price down near the intraday low, the selloff is over and we can call it a day—or is the subsidy simply still being paid while the price hasn’t climbed out of the hole? Drop counterexamples in the comments.
$WLD: Nearly flat on the day at about +0.2%; down about −13.1% over the week. Current price: about 0.2611. Weekly high: about 0.3075; drawdown: about −15.1%. Account long/short ratio: about 1.46 (about 59% long; around a day ago it was about 1.48/60%, so the long share has barely moved). Funding is inverted at about −0.0204%/8h, paying an outsized subsidy far beyond the usual cap. OI contract count over the past day: about −1.1% (about −0.5% in USD terms; positions have barely changed). Price has slid from the intraday high of about 0.2688 and remains not far from the intraday low of about 0.255; it is still in the weekly hole. The long share is pinned at about 59% and has barely moved, inverted funding is paying an outsized subsidy, and positions have barely been reduced—don’t take 0.2611 being nearly flat, with inverted funding paying a subsidy far beyond the usual cap, as proof that this selloff is over. And don’t take the US session nearing its close with price near the intraday low as a signal that you can call it a day.
In the same session, $SEI was down about −2.1% over the day and about −11.4% over the week. Current price: about 0.03814. Weekly high: about 0.04444; drawdown: about −14.2%. Long share: about 59% (long/short ratio about 1.41; around a day ago it was about 1.50/60%, so longs are backing off). Funding is inverted at about −0.0197%/8h, paying an outsized subsidy far beyond the usual cap. OI over the past day: about +0.6% (about −1.0% in USD terms, mostly due to the price drop; contract count has barely changed). Price has slid from the intraday high of about 0.03942 and is near the intraday low of about 0.03742; it is still in the weekly hole. The long share has eased from about 60% to 59%, inverted funding is paying an outsized subsidy, and the position count has barely been reduced.
One was nearly flat during the day, with inverted funding paying an outsized subsidy; the long share was still pinned at about 59%, positions had barely been reduced, and it was still in the weekly hole. The other saw its L1 long share ease slightly from about 60% to 59%, sold off about 2% during the day, also had inverted funding paying an outsized subsidy, and saw barely any change in contract count. Does this mean that with the US session nearing its close and price down near the intraday low, the selloff is over and we can call it a day—or is the subsidy simply still being paid while the price hasn’t climbed out of the hole? Drop counterexamples in the comments.