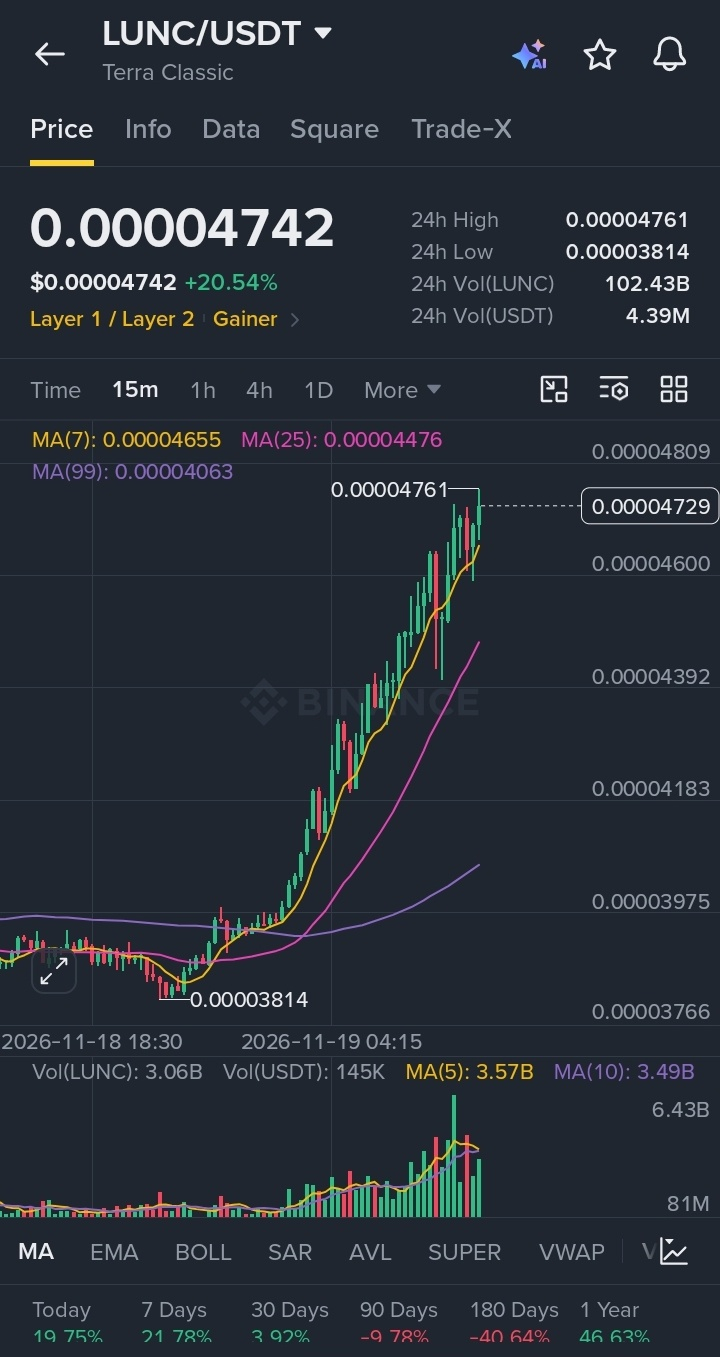

$LUNC (Terra Classic) Latest Analysis – 19 November 2026
Important market data
Indicator Latest data
Market cap $251.32 million
24h trading range $0.00003820–$0.00004611
7-day change +21.24%
Circulating supply 5.52 trillion
Open interest $11.37 million
Funding rate -0.0241%
Technical analysis
According to the latest technical indicators:
Daily RSI: 55.63 (neutral).
Weekly RSI: 35.46 (weak).
Hourly RSI: 67.89 (approaching overbought).
Daily trend: bearish.
Hourly trend: mildly bullish.
Important support and resistance
Resistance levels
R3: $0.00005500
R2: $0.00005000 Major psychological level
R1: $0.00004610 Immediate resistance
Support levels
S1: $0.00004200 Near support
S2: $0.00003820 Important support
S3: $0.00003500 Deeper support
These are indicative trading levels based on recent price action, not confirmed exchange order-book levels.
price prediction
Scenario Potential price
Bullish $0.000050–0.000055
Very bullish $0.000060
Bearish $0.000038
Strong bearish $0.000035
#NvidiaBoardReportedlySplitOverHuang’sReturn #CanGTA6'sLaunchLiftTTWOShares?