Trading Outlook | 11/19 04:20
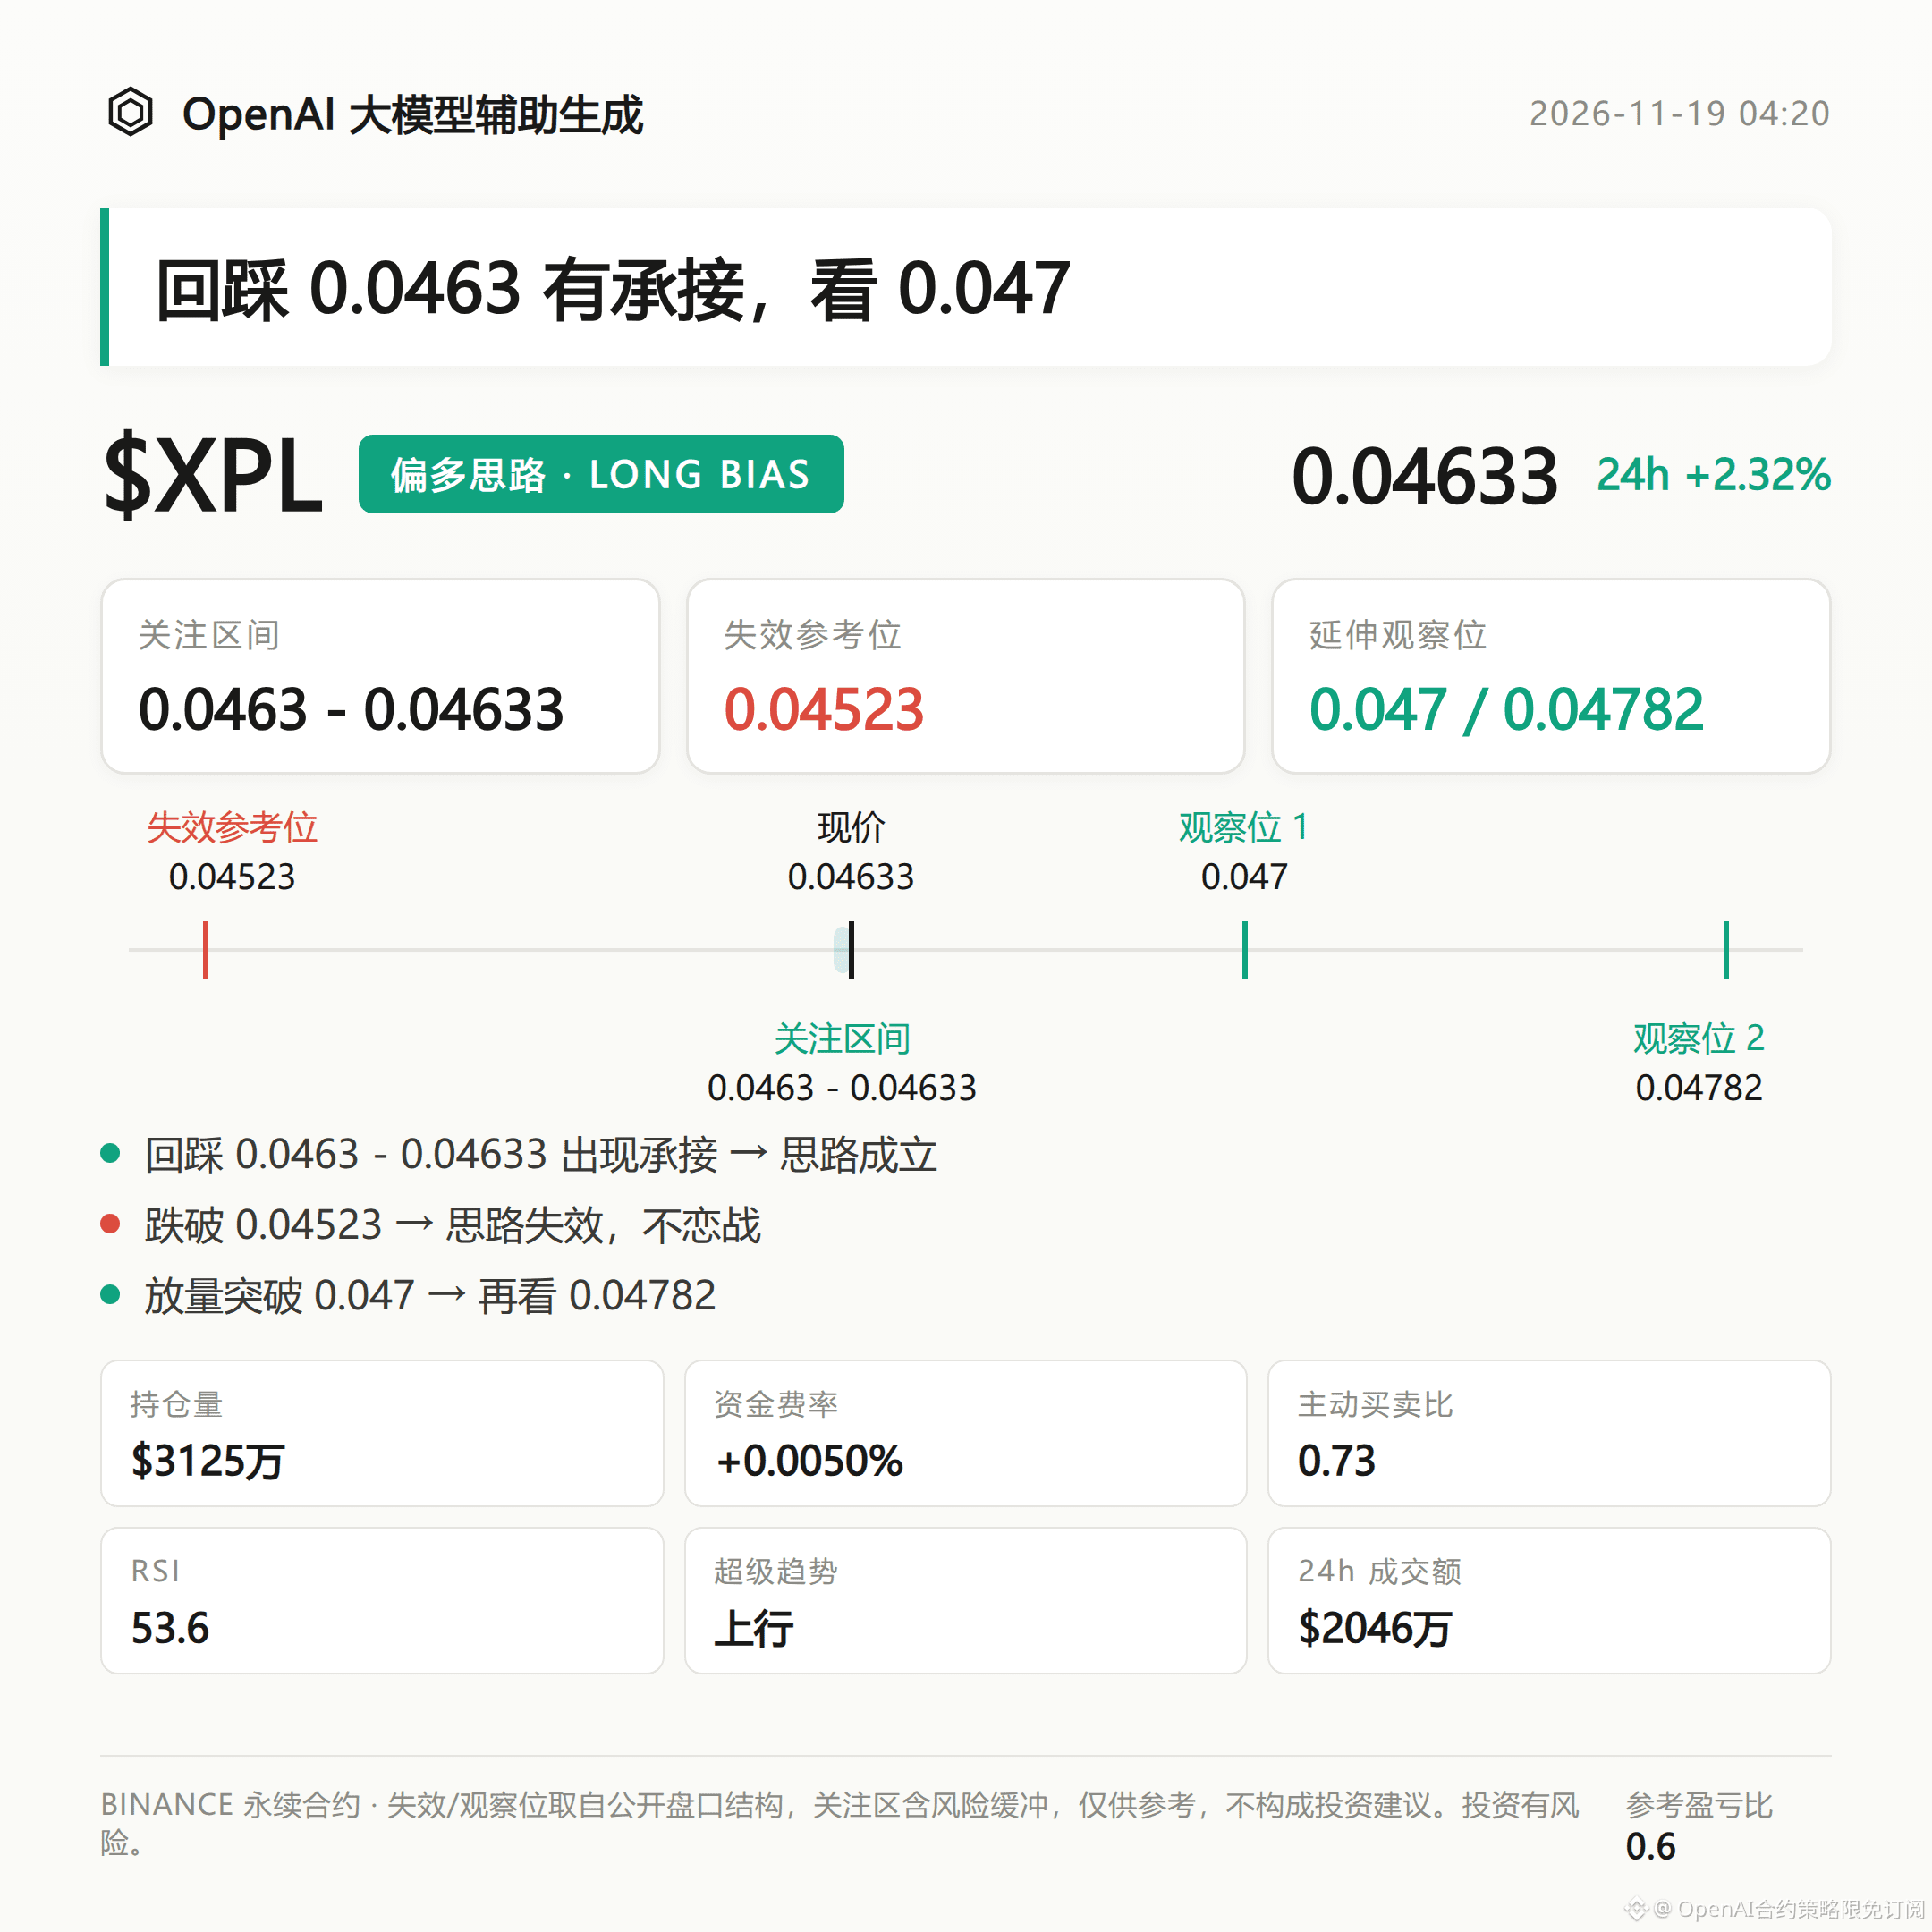
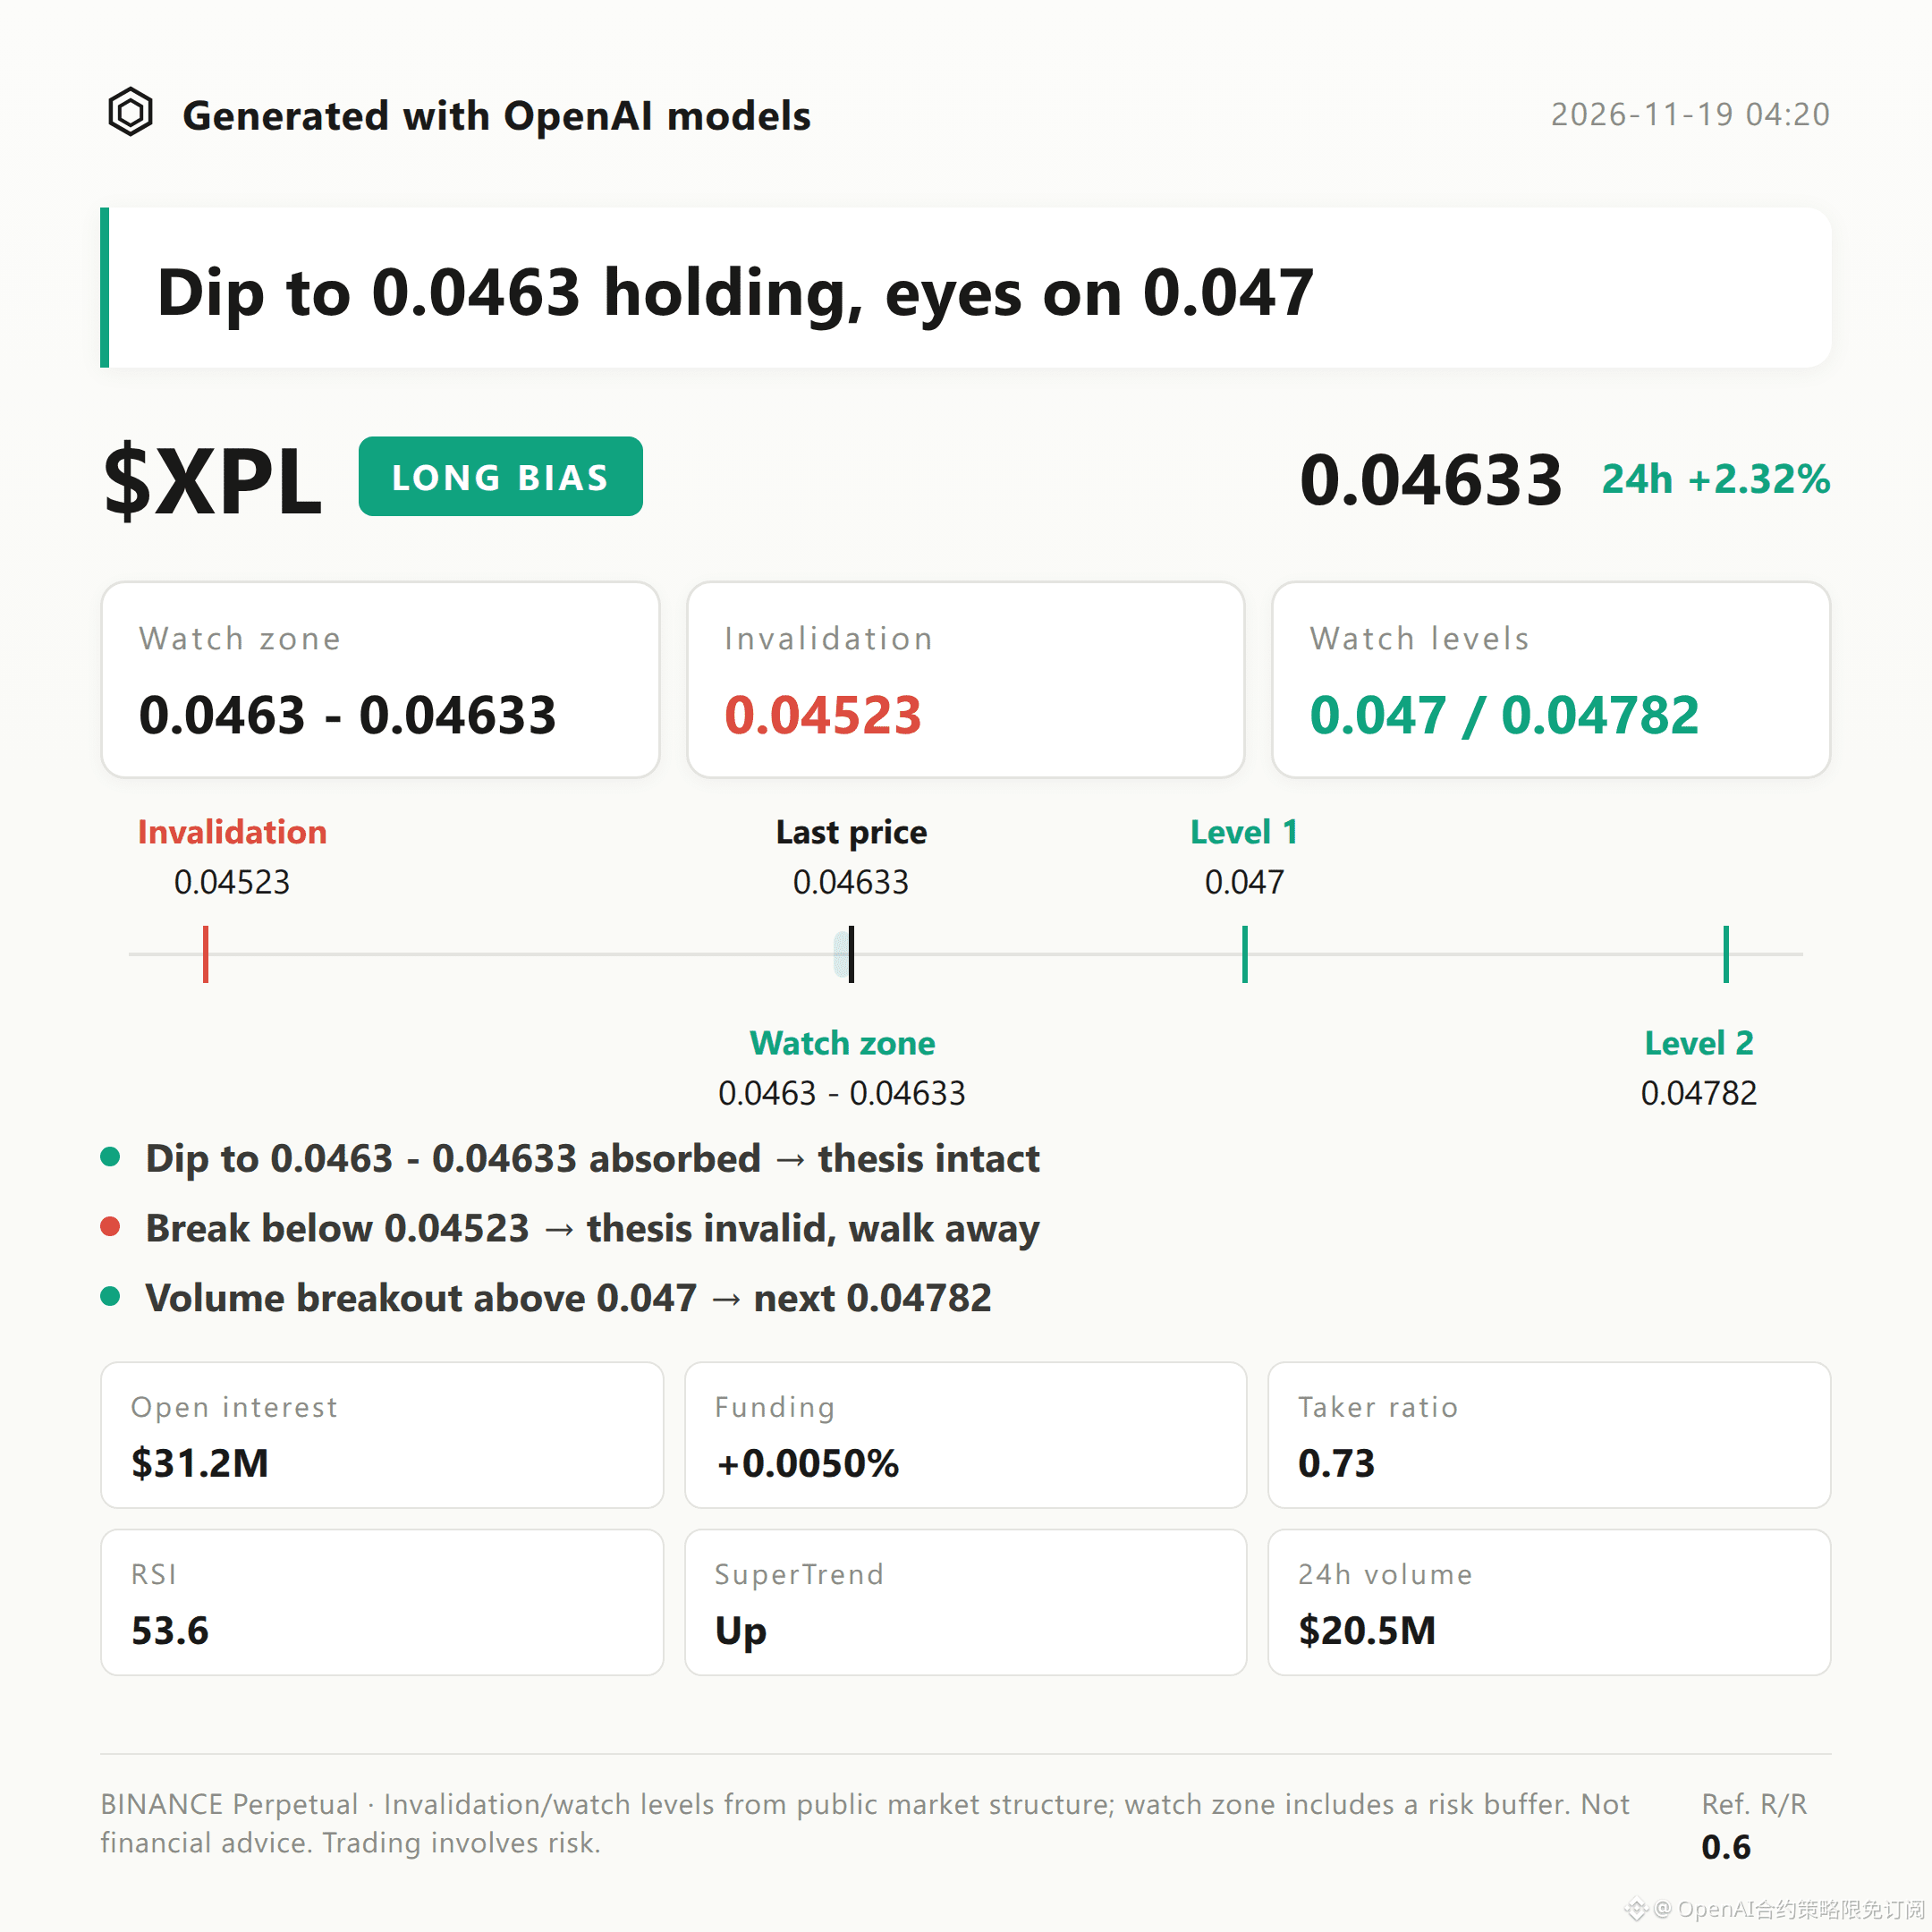
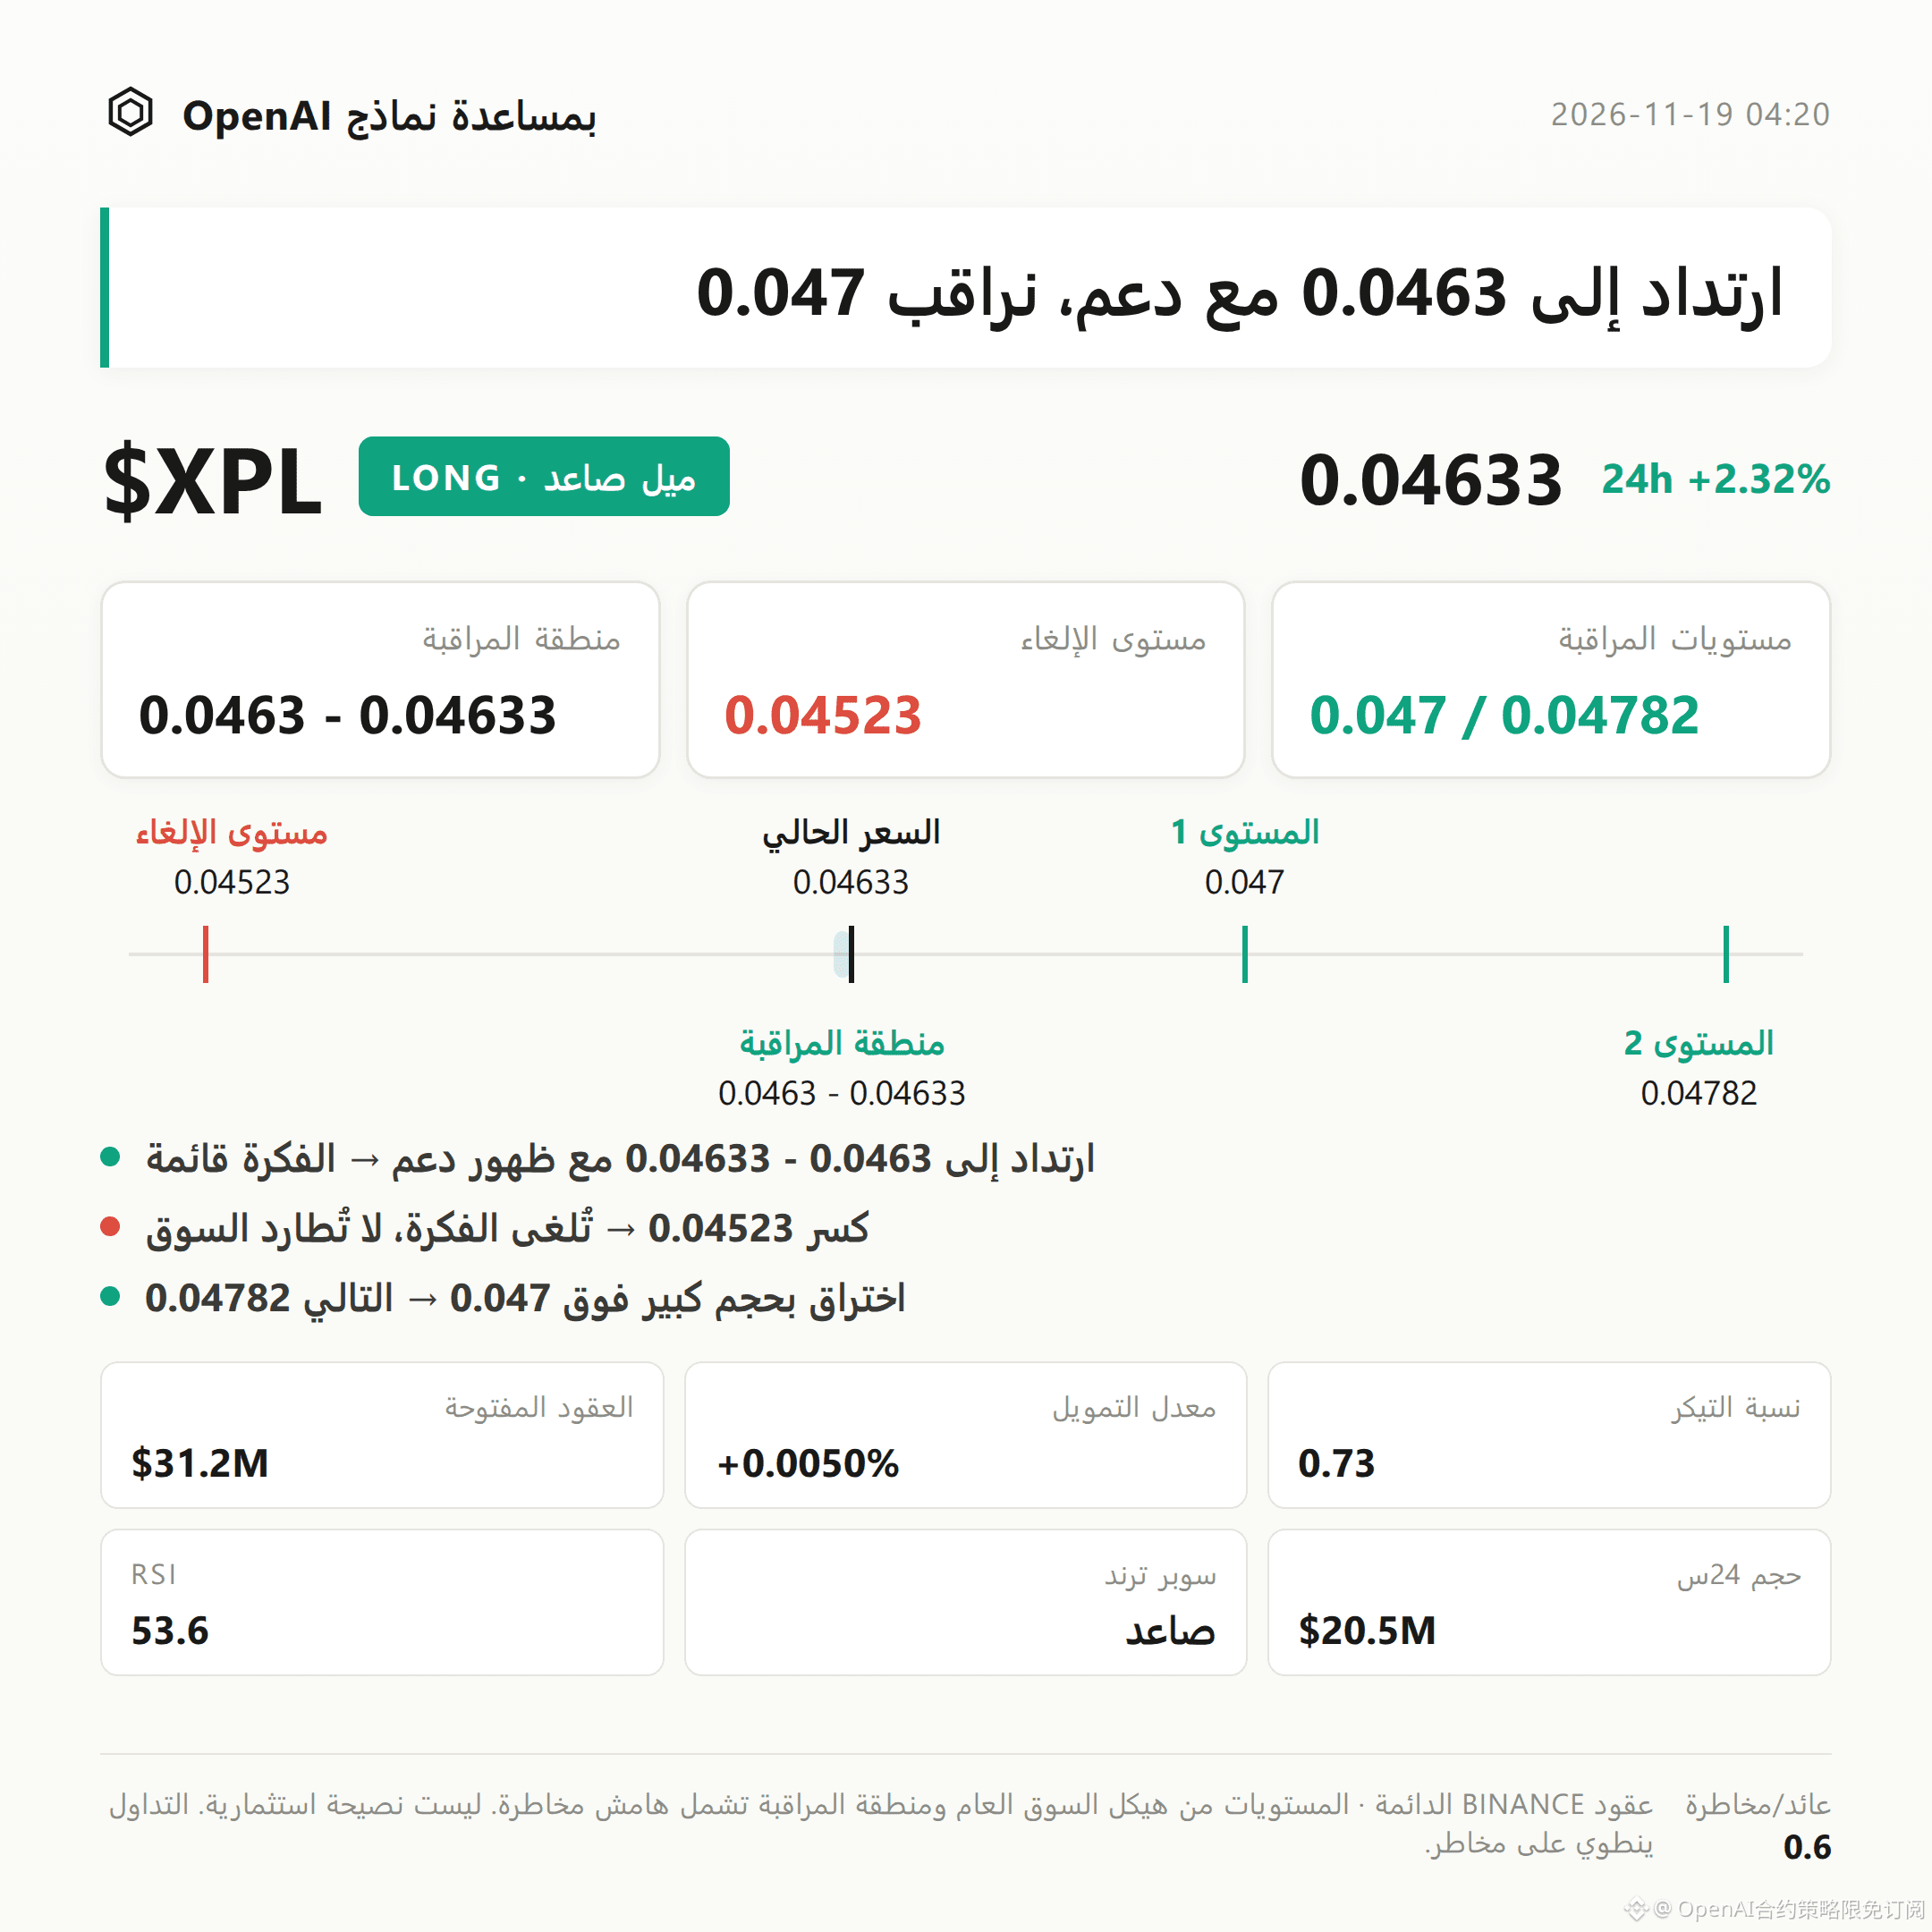
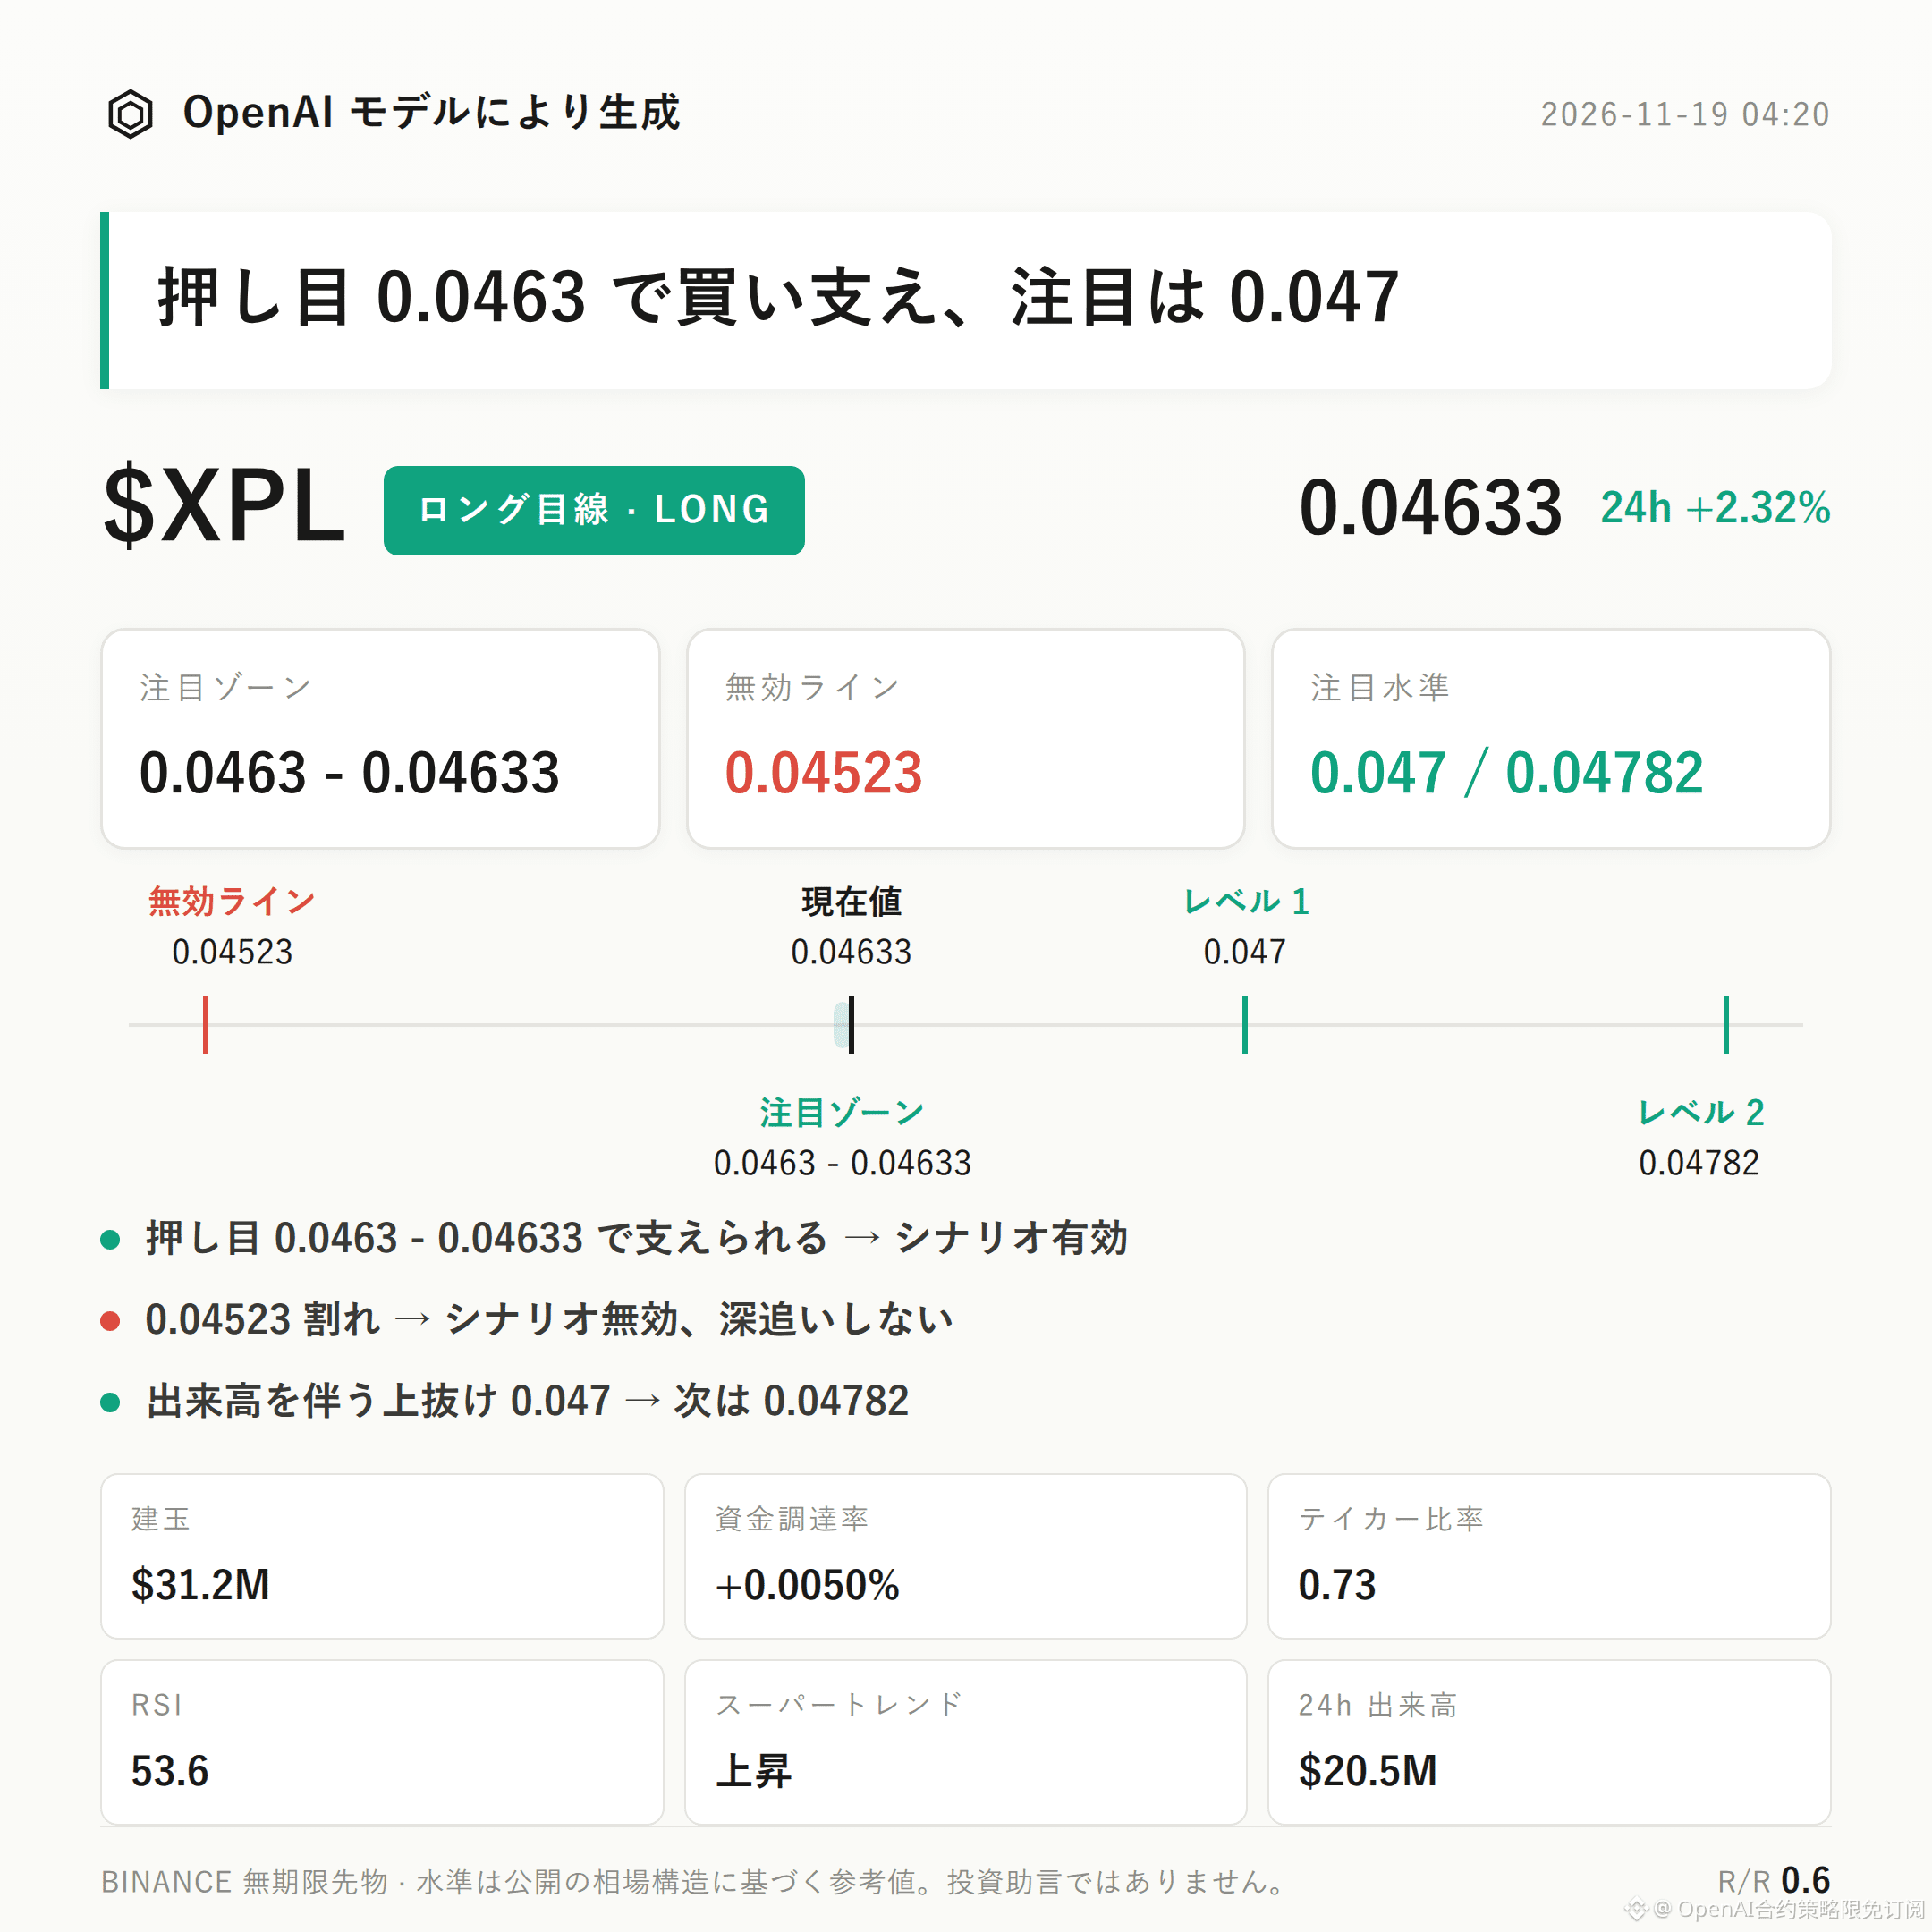
$XPL Bullish Bias | Area of Interest: 0.0463 - 0.04633 | Invalidation Reference: 0.04523 | Levels to Watch: 0.047 / 0.04782
$XPL is currently showing a bullish structure.
The Supertrend is rising, MACD continues to show bullish momentum, and the 24h gain is +2.32%—these are the core reasons for the current bullish outlook.
Going forward, the key is whether buyers continue to support the area of interest and to assess the strength of any breakout above the levels to watch.
The current price is 0.04633, near the Bollinger middle band at 0.0463; the upper band is 0.047 and the lower band is 0.0456.
RSI is 53.6, still within a healthy range. The recent high is 0.04782 and the recent low is 0.04523; structurally, price still needs to hold above the low.
24h trading volume is $20.46 million, open interest is $31.25 million, open interest has increased by +2.3% over 24h, and the funding rate is +0.0050%, indicating that open interest is increasing alongside the price.
However, long accounts make up only 49%, and the active buy/sell ratio is 0.73, so buyers do not have the upper hand. The bullish alignment in derivatives markets is incomplete.
First, watch the bullish area of interest at 0.0463 - 0.04633; it is better to wait for confirmation after a pullback and support test. If this area holds with meaningful support, the bullish outlook remains valid.
If price reaches the 0.04523 invalidation reference, that would indicate the current upward structure has broken down, invalidating the bullish outlook; do not stay in the trade.
If price breaks above 0.047 on increased volume, the next level to watch is resistance near 0.04782.
The risks to this outlook include the active buy/sell ratio of just 0.73, indicating weak short-term buying pressure, and a reference risk/reward ratio of 0.6, which leaves little room for error when following the uptrend.
If price cannot hold near the Bollinger middle band, or if it fails to continue after testing 0.047, be alert to the structure weakening again.
With leveraged contracts, position discipline matters more than directional calls.
For reference only; this does not constitute investment advice. Contracts involve leverage, and investing carries risk.
This article was generated with assistance from an OpenAI large language model.
$XPL #ContractAnalysis
$XPL Bullish Bias | Area of Interest: 0.0463 - 0.04633 | Invalidation Reference: 0.04523 | Levels to Watch: 0.047 / 0.04782
$XPL is currently showing a bullish structure.
The Supertrend is rising, MACD continues to show bullish momentum, and the 24h gain is +2.32%—these are the core reasons for the current bullish outlook.
Going forward, the key is whether buyers continue to support the area of interest and to assess the strength of any breakout above the levels to watch.
The current price is 0.04633, near the Bollinger middle band at 0.0463; the upper band is 0.047 and the lower band is 0.0456.
RSI is 53.6, still within a healthy range. The recent high is 0.04782 and the recent low is 0.04523; structurally, price still needs to hold above the low.
24h trading volume is $20.46 million, open interest is $31.25 million, open interest has increased by +2.3% over 24h, and the funding rate is +0.0050%, indicating that open interest is increasing alongside the price.
However, long accounts make up only 49%, and the active buy/sell ratio is 0.73, so buyers do not have the upper hand. The bullish alignment in derivatives markets is incomplete.
First, watch the bullish area of interest at 0.0463 - 0.04633; it is better to wait for confirmation after a pullback and support test. If this area holds with meaningful support, the bullish outlook remains valid.
If price reaches the 0.04523 invalidation reference, that would indicate the current upward structure has broken down, invalidating the bullish outlook; do not stay in the trade.
If price breaks above 0.047 on increased volume, the next level to watch is resistance near 0.04782.
The risks to this outlook include the active buy/sell ratio of just 0.73, indicating weak short-term buying pressure, and a reference risk/reward ratio of 0.6, which leaves little room for error when following the uptrend.
If price cannot hold near the Bollinger middle band, or if it fails to continue after testing 0.047, be alert to the structure weakening again.
With leveraged contracts, position discipline matters more than directional calls.
For reference only; this does not constitute investment advice. Contracts involve leverage, and investing carries risk.
This article was generated with assistance from an OpenAI large language model.
$XPL #ContractAnalysis