🚀 Technical Analysis $XRP /USDT (Real-Time Perspective)
📊 Timeframes analyzed: 1H and 15M charts
💎 Asset: XRP/USDT (Perp)
💰 Current price: ~0.9803 USDT
🔍 Market Breakdown:
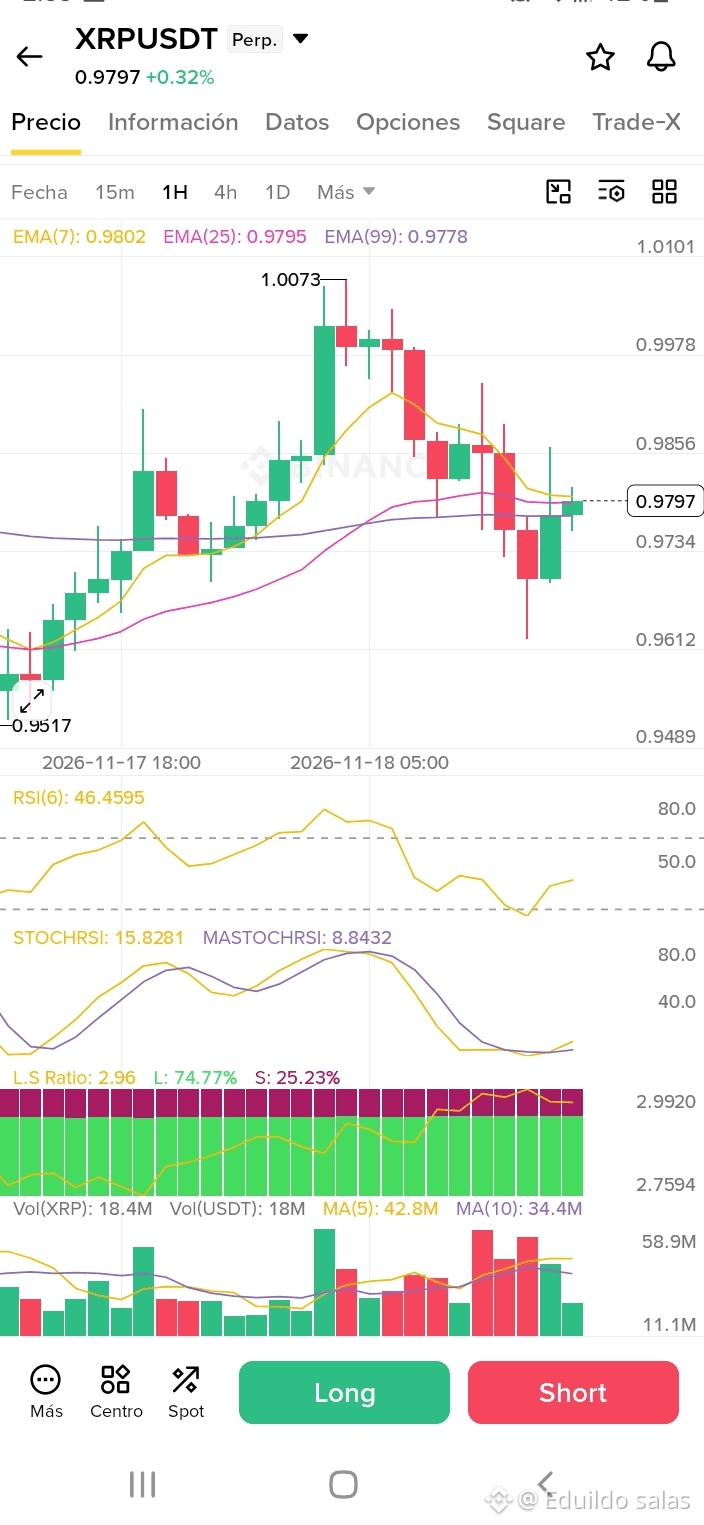
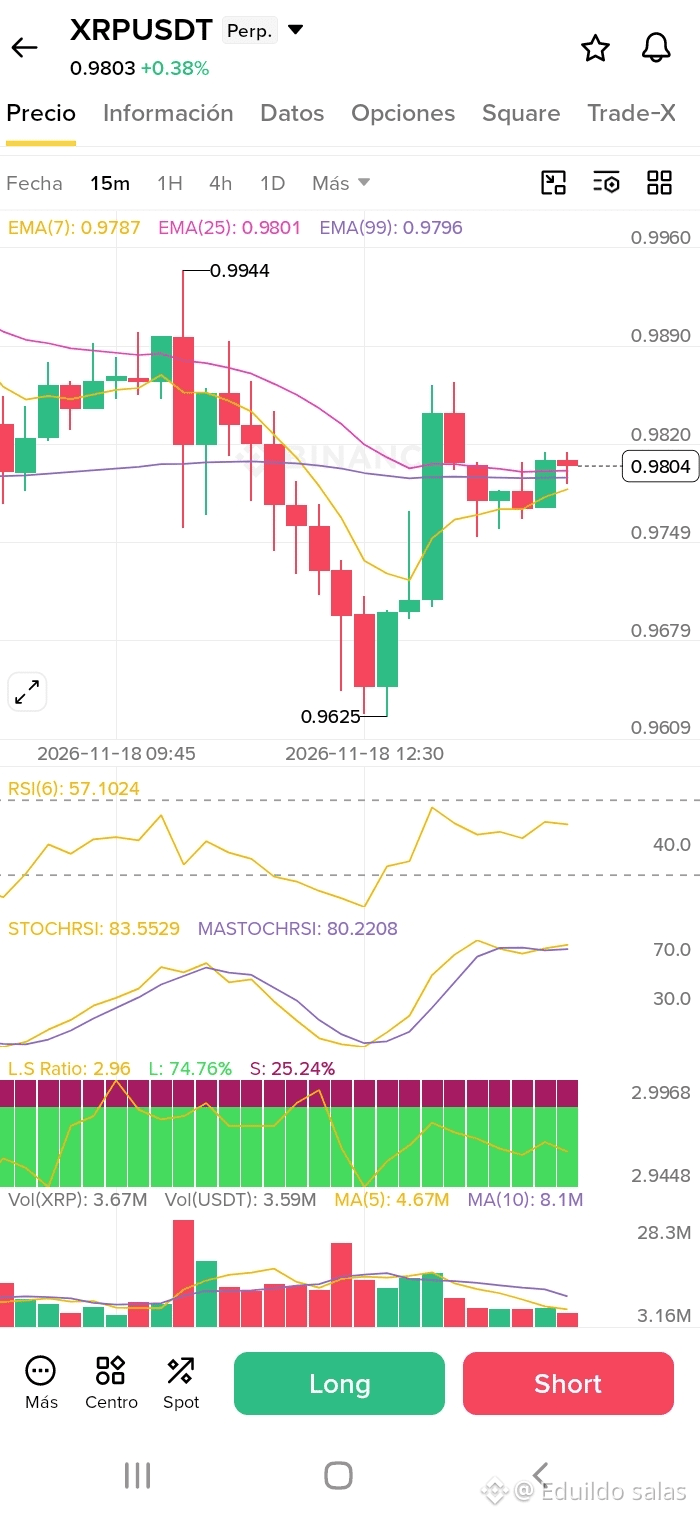
Price Action and Trend: After a strong rebound from the key support zone at 0.9625 USDT (following a previous low of 0.9517 USDT on the 1H chart), the price has shown a rapid V-shaped recovery and is currently stabilizing above 0.9800 USDT.
Moving Averages (EMA): On the 15-minute chart, the faster EMAs (EMA 7 and EMA 25) are crossing and flattening right around 0.9800–0.9804 USDT, indicating a short-term zone of indecision, but with buying pressure attempting to establish a floor.
Momentum Indicators (RSI and StochRSI):
The RSI (6) is in neutral-to-bullish territory (~57.10), showing that there is still room to rise before entering overbought territory.
The StochRSI shows a crossover emerging from the lower zone, supporting the immediate bullish momentum following the rebound.
Sentiment and Long/Short Ratio: The Long/Short ratio remains elevated at 2.96, with 74.76% of positions Long versus 25.24% Short. This shows a strong bullish bias among the crowd, although we should watch for potential liquidity sweeps if the price falters.
🎯 Quick Strategy / Levels to Watch:
Key support: 0.9749–0.9679 USDT.
Key resistance: 0.9890–0.9944 USDT.
Are we seeing the decisive push to break the psychological 1.00 USDT barrier, or will we see a retest of lower support levels? Let me know in the comments! 👇💬
#XRP #BinanceSquare #CanNvidia’sDataCenterGrowthContinue?
📊 Timeframes analyzed: 1H and 15M charts
💎 Asset: XRP/USDT (Perp)
💰 Current price: ~0.9803 USDT
🔍 Market Breakdown:
Price Action and Trend: After a strong rebound from the key support zone at 0.9625 USDT (following a previous low of 0.9517 USDT on the 1H chart), the price has shown a rapid V-shaped recovery and is currently stabilizing above 0.9800 USDT.
Moving Averages (EMA): On the 15-minute chart, the faster EMAs (EMA 7 and EMA 25) are crossing and flattening right around 0.9800–0.9804 USDT, indicating a short-term zone of indecision, but with buying pressure attempting to establish a floor.
Momentum Indicators (RSI and StochRSI):
The RSI (6) is in neutral-to-bullish territory (~57.10), showing that there is still room to rise before entering overbought territory.
The StochRSI shows a crossover emerging from the lower zone, supporting the immediate bullish momentum following the rebound.
Sentiment and Long/Short Ratio: The Long/Short ratio remains elevated at 2.96, with 74.76% of positions Long versus 25.24% Short. This shows a strong bullish bias among the crowd, although we should watch for potential liquidity sweeps if the price falters.
🎯 Quick Strategy / Levels to Watch:
Key support: 0.9749–0.9679 USDT.
Key resistance: 0.9890–0.9944 USDT.
Are we seeing the decisive push to break the psychological 1.00 USDT barrier, or will we see a retest of lower support levels? Let me know in the comments! 👇💬
#XRP #BinanceSquare #CanNvidia’sDataCenterGrowthContinue?