11.19 Chen Jie Night Analysis
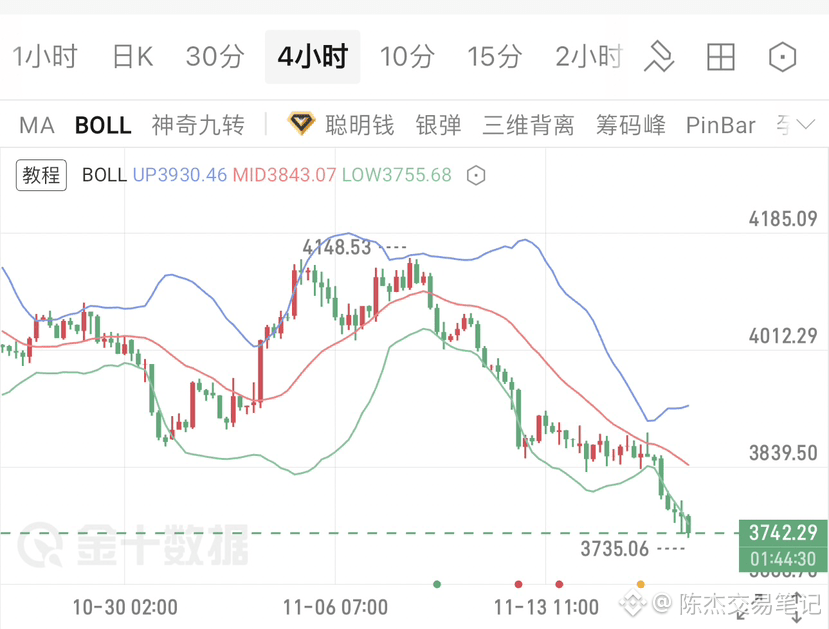
Fed meeting minutes showed that most policymakers favored continuing to tighten policy to curb inflation. Meanwhile, the U.S. reaffirmed its stance on sanctions against Russian oil. Rising Treasury yields and delayed rate-cut expectations triggered a wave of quantitative stop-loss selling, outweighing support from ETF inflows (+2.56 tonnes), central bank reserves (+25.82 tonnes), and broad declines in U.S. stocks. Gold plunged more than 122 points in a one-way drop from 3857, hitting a new recent low of 3735 and currently trading around 3742. On Thursday, watch U.S. initial jobless claims and remarks from officials including Williams.
The daily chart closed with a large bearish engulfing candle, with the body breaking below the lower daily Bollinger Band (3777) and the 3800 level. The 6-hour, 8-hour, and 12-hour charts show a three black crows pattern, while the MACD histogram is expanding downward at an accelerating pace.
After plunging to 3735, the 4-hour RSI fell to 7.94, indicating extreme oversold conditions. The 15-minute and 30-minute charts show signs of bullish divergence at low levels, with 3742 just above the 6-hour lower Bollinger Band (3743) and the 15-minute lower band (3729). The 3768–3778 area above brings together the 30-minute middle band (3764), the 1-hour middle band (3782), and the daily lower-band support/resistance flip zone. Wait for a rebound into this area before entering long.
Trading strategy
Short at 3770–3780; target 3740–3710–3680; stop-loss 3798#xau $XAU
Fed meeting minutes showed that most policymakers favored continuing to tighten policy to curb inflation. Meanwhile, the U.S. reaffirmed its stance on sanctions against Russian oil. Rising Treasury yields and delayed rate-cut expectations triggered a wave of quantitative stop-loss selling, outweighing support from ETF inflows (+2.56 tonnes), central bank reserves (+25.82 tonnes), and broad declines in U.S. stocks. Gold plunged more than 122 points in a one-way drop from 3857, hitting a new recent low of 3735 and currently trading around 3742. On Thursday, watch U.S. initial jobless claims and remarks from officials including Williams.
The daily chart closed with a large bearish engulfing candle, with the body breaking below the lower daily Bollinger Band (3777) and the 3800 level. The 6-hour, 8-hour, and 12-hour charts show a three black crows pattern, while the MACD histogram is expanding downward at an accelerating pace.
After plunging to 3735, the 4-hour RSI fell to 7.94, indicating extreme oversold conditions. The 15-minute and 30-minute charts show signs of bullish divergence at low levels, with 3742 just above the 6-hour lower Bollinger Band (3743) and the 15-minute lower band (3729). The 3768–3778 area above brings together the 30-minute middle band (3764), the 1-hour middle band (3782), and the daily lower-band support/resistance flip zone. Wait for a rebound into this area before entering long.
Trading strategy
Short at 3770–3780; target 3740–3710–3680; stop-loss 3798#xau $XAU