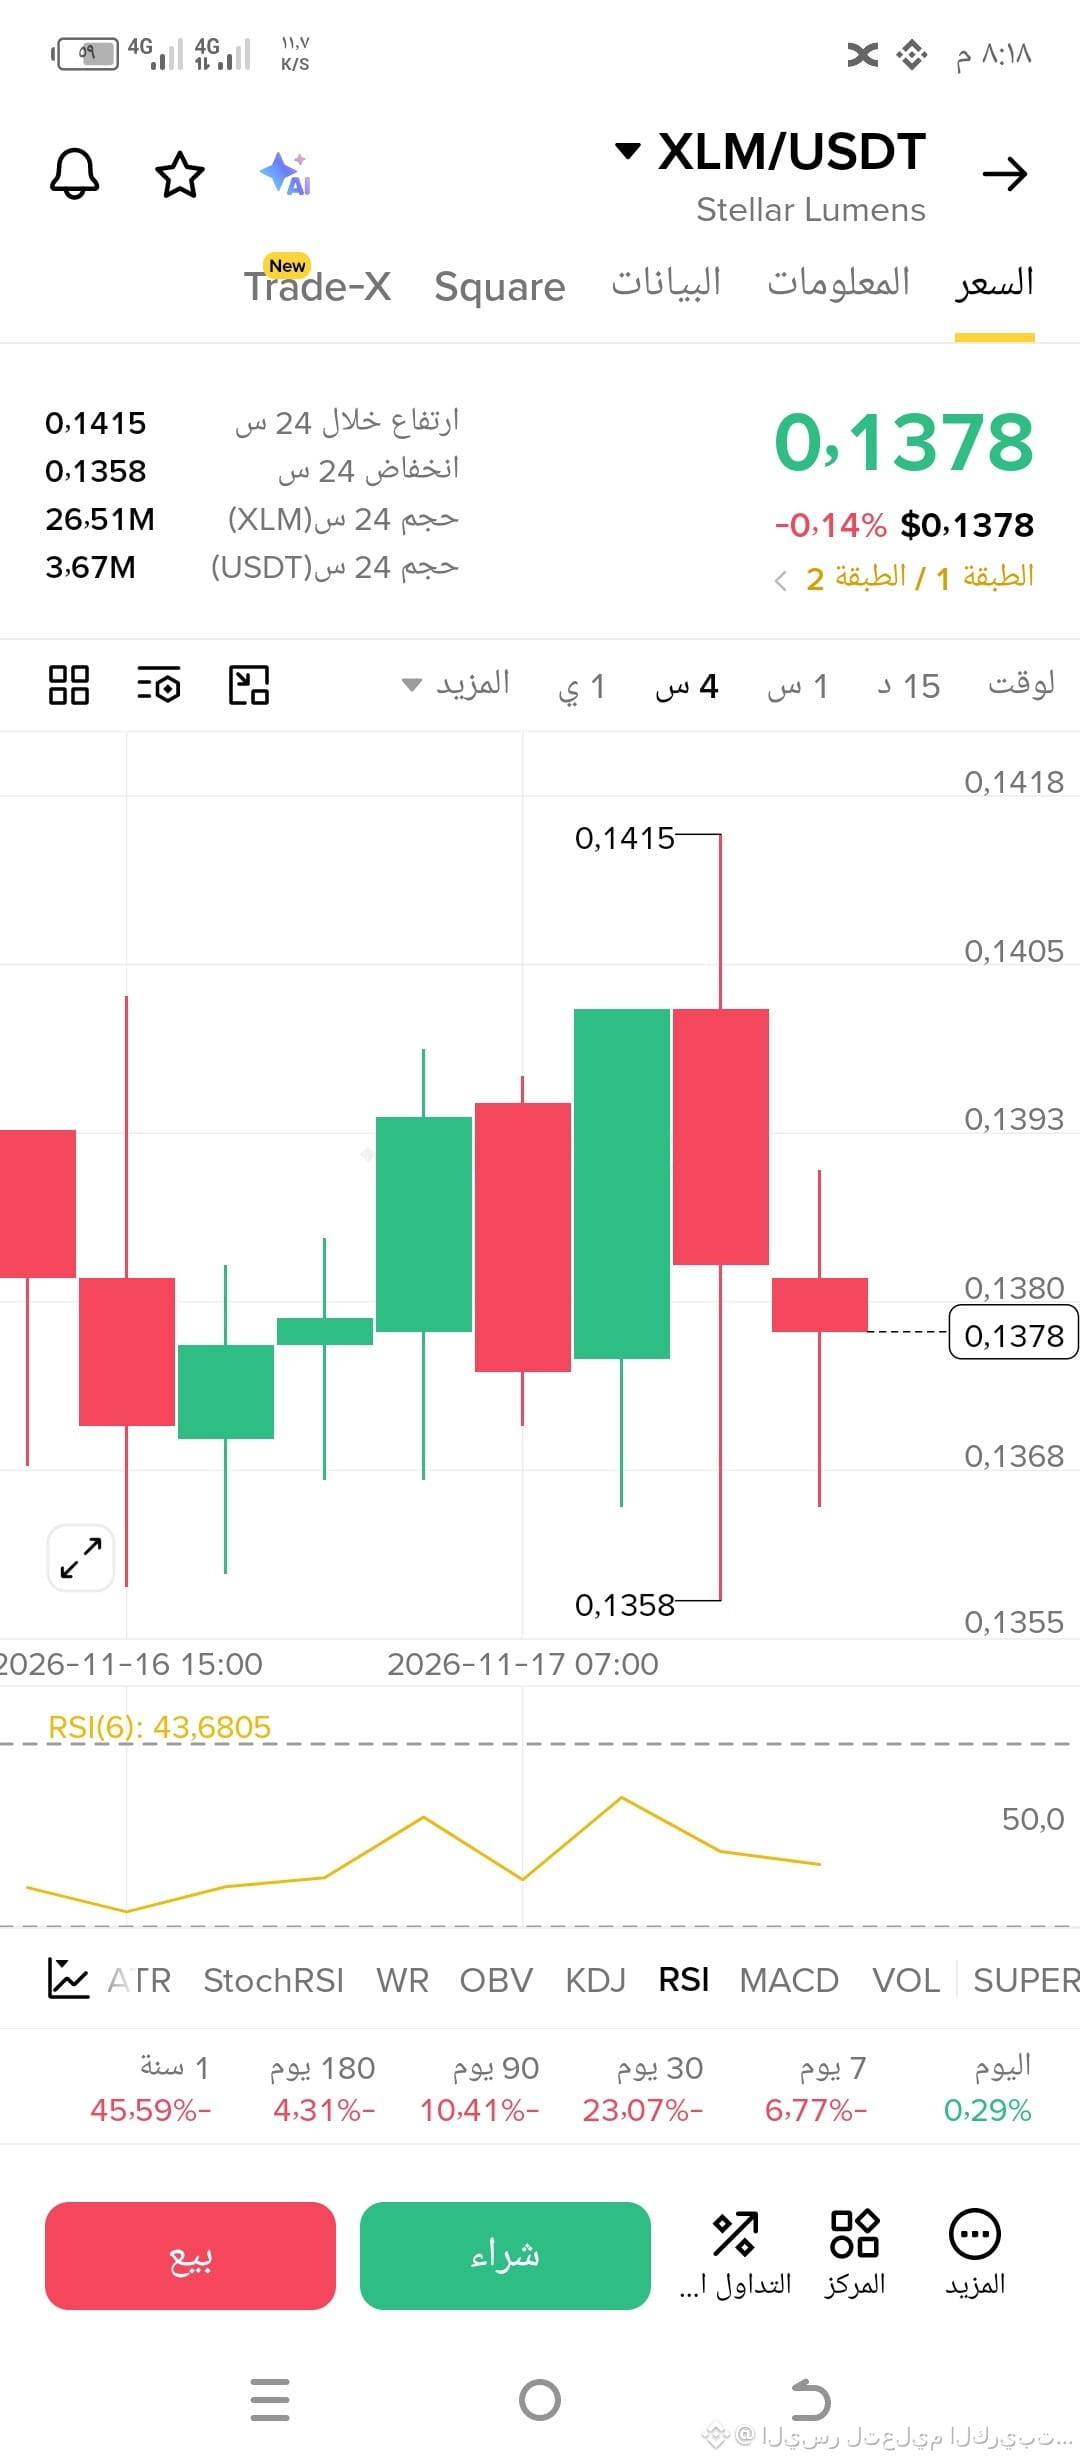
🔍 Strict analysis of the $XLM chart (4-hour timeframe):
The long upper wick at $0.1415 reveals the truth clearly:
a sharp price rejection and liquidity being drained at the top! 🛑📉
The price is currently fluctuating around $0.1378, and the RSI is below 50 (43.6), indicating weak buying momentum.
💡 The Yusr rule: Don’t rush in amid the fluctuation; there’s no confirmed rise unless the price closes clearly above $0.1415. A break below $0.1358 means further downside. 🛡
⚠️ Educational content, not financial advice (DYOR).
$BTC $BTC $XLM
#BinanceSquare
#XLM
#تحليل_فني
#اليسر_لتعليم_الكريبتو
#تداول_فوري
The long upper wick at $0.1415 reveals the truth clearly:
a sharp price rejection and liquidity being drained at the top! 🛑📉
The price is currently fluctuating around $0.1378, and the RSI is below 50 (43.6), indicating weak buying momentum.
💡 The Yusr rule: Don’t rush in amid the fluctuation; there’s no confirmed rise unless the price closes clearly above $0.1415. A break below $0.1358 means further downside. 🛡
⚠️ Educational content, not financial advice (DYOR).
$BTC $BTC $XLM
#BinanceSquare
#XLM
#تحليل_فني
#اليسر_لتعليم_الكريبتو
#تداول_فوري