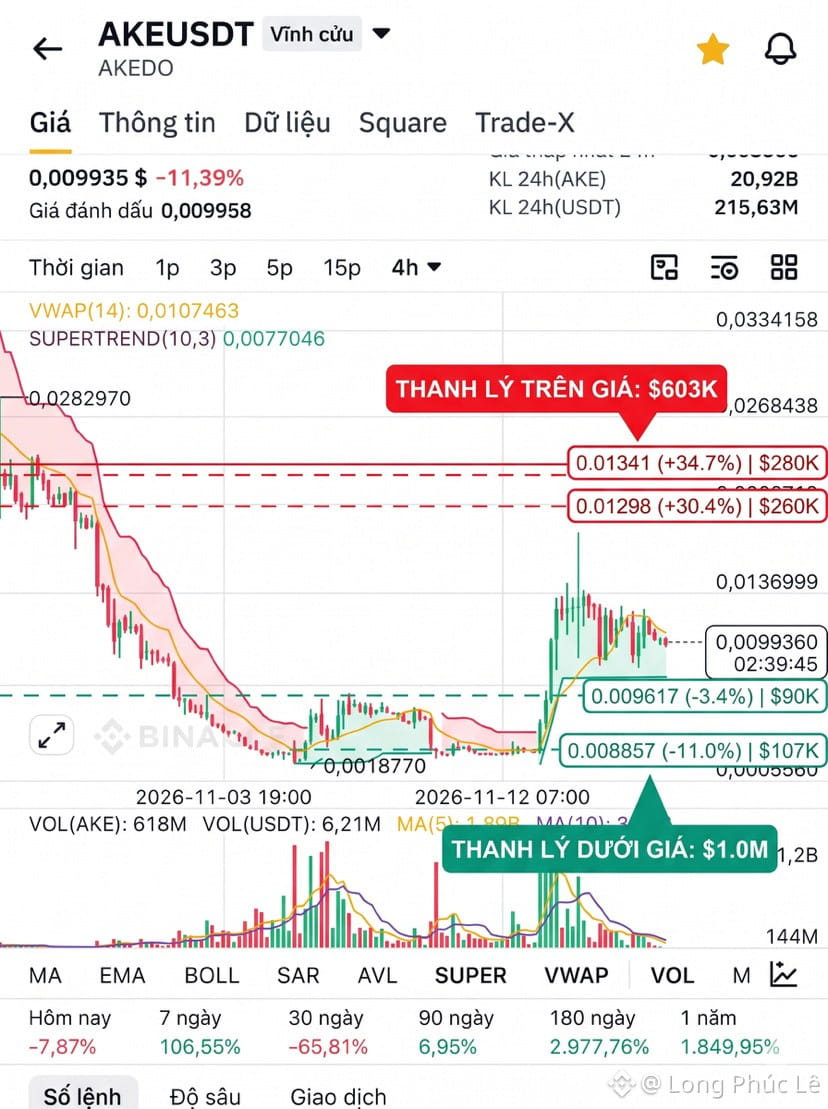
$AKE 🚨 ANALYSIS OF $AKE (#AKEUSDT) H4 TIMEFRAME: BULLISH FLAG PATTERN & LIQUIDATION MAP 📊
After a sharp rise from the bottom range of 0.00188–0.0020 to a peak of 0.0180, AKEDO ($AKE ) is entering a consolidation pullback around 0.0099–0.0100 USDT on the 4H timeframe.
🔍 Technical structure:
• Price pattern: A clear Bullish Flag has formed, with a strong upward flagpole and a narrowing sideways flag, accompanied by cooling liquidity.
• Momentum: The H4 RSI indicator remains around the neutral range (43.5–54.2), suggesting that selling pressure is easing and there is still room for another move.
🧲 Notable liquidation clusters:
• Below the current price — Total $1.0M (Longs): The two nearest liquidity clusters are at 0.009617 (-3.4% | $90K) and 0.008857 (-11.0% | $107K), just above the 24-hour low of 0.008306.
• Above the current price — Total $603K (Shorts): Two large clusters are concentrated at 0.01298 (+30.4% | $260K) and 0.01341 (+34.7% | $280K).
🎯 Trading scenarios:
1. Liquidity sweep with a downside wick: Liquidations below ($1.0M) are slightly higher than those above ($603K), so the price could sweep down to the 0.00885–0.0096 range to absorb Long liquidity before bouncing.
2. Breakout scenario: If the current price base holds and the upper edge of the flag breaks with strong volume, the next target would be the Short liquidation cluster at 0.0130–0.0134.
⚠️ This post is for technical analysis purposes only and is not investment advice (NFA). Remember to set your SL and manage your capital carefully!
#AKEUSDT #AKEDO #BinanceSquare #Write2Earn #CryptoAnalysis
After a sharp rise from the bottom range of 0.00188–0.0020 to a peak of 0.0180, AKEDO ($AKE ) is entering a consolidation pullback around 0.0099–0.0100 USDT on the 4H timeframe.
🔍 Technical structure:
• Price pattern: A clear Bullish Flag has formed, with a strong upward flagpole and a narrowing sideways flag, accompanied by cooling liquidity.
• Momentum: The H4 RSI indicator remains around the neutral range (43.5–54.2), suggesting that selling pressure is easing and there is still room for another move.
🧲 Notable liquidation clusters:
• Below the current price — Total $1.0M (Longs): The two nearest liquidity clusters are at 0.009617 (-3.4% | $90K) and 0.008857 (-11.0% | $107K), just above the 24-hour low of 0.008306.
• Above the current price — Total $603K (Shorts): Two large clusters are concentrated at 0.01298 (+30.4% | $260K) and 0.01341 (+34.7% | $280K).
🎯 Trading scenarios:
1. Liquidity sweep with a downside wick: Liquidations below ($1.0M) are slightly higher than those above ($603K), so the price could sweep down to the 0.00885–0.0096 range to absorb Long liquidity before bouncing.
2. Breakout scenario: If the current price base holds and the upper edge of the flag breaks with strong volume, the next target would be the Short liquidation cluster at 0.0130–0.0134.
⚠️ This post is for technical analysis purposes only and is not investment advice (NFA). Remember to set your SL and manage your capital carefully!
#AKEUSDT #AKEDO #BinanceSquare #Write2Earn #CryptoAnalysis