$BTC 📊 WEEKLY CLOSE REPORT · BITCOIN (BTC)
📅 Sunday, November 15, 2026
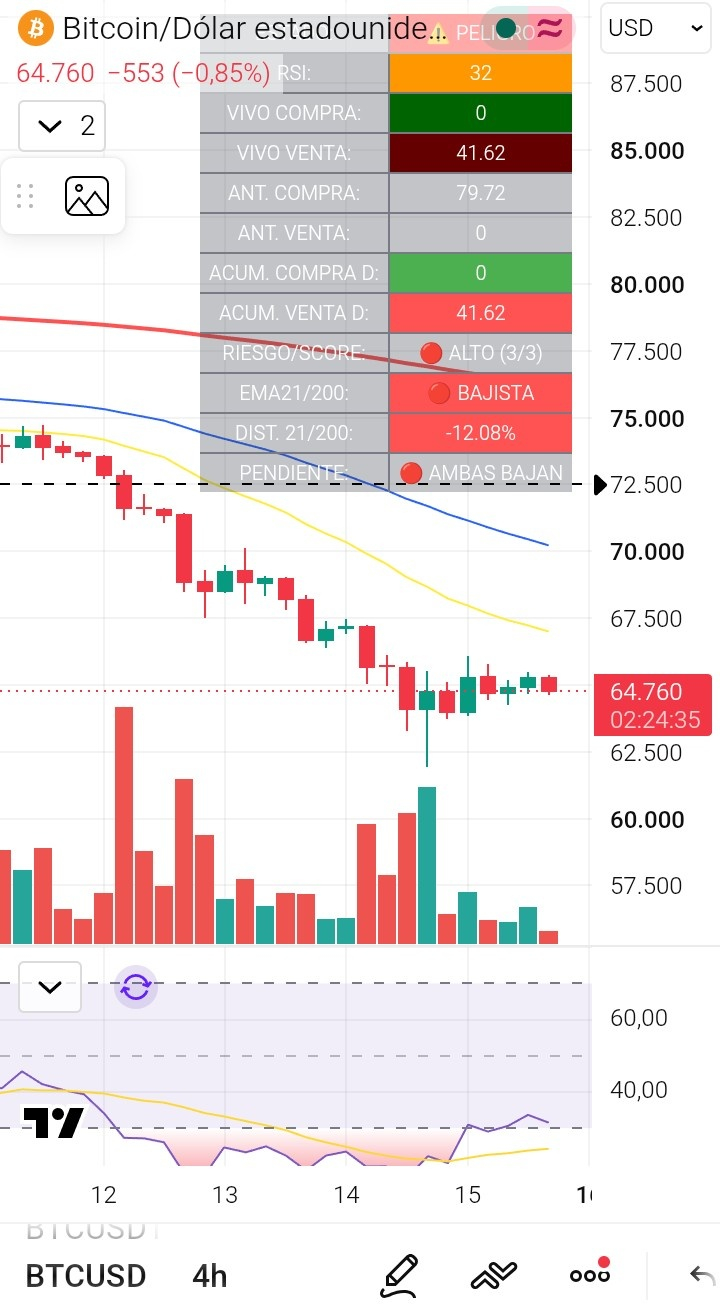
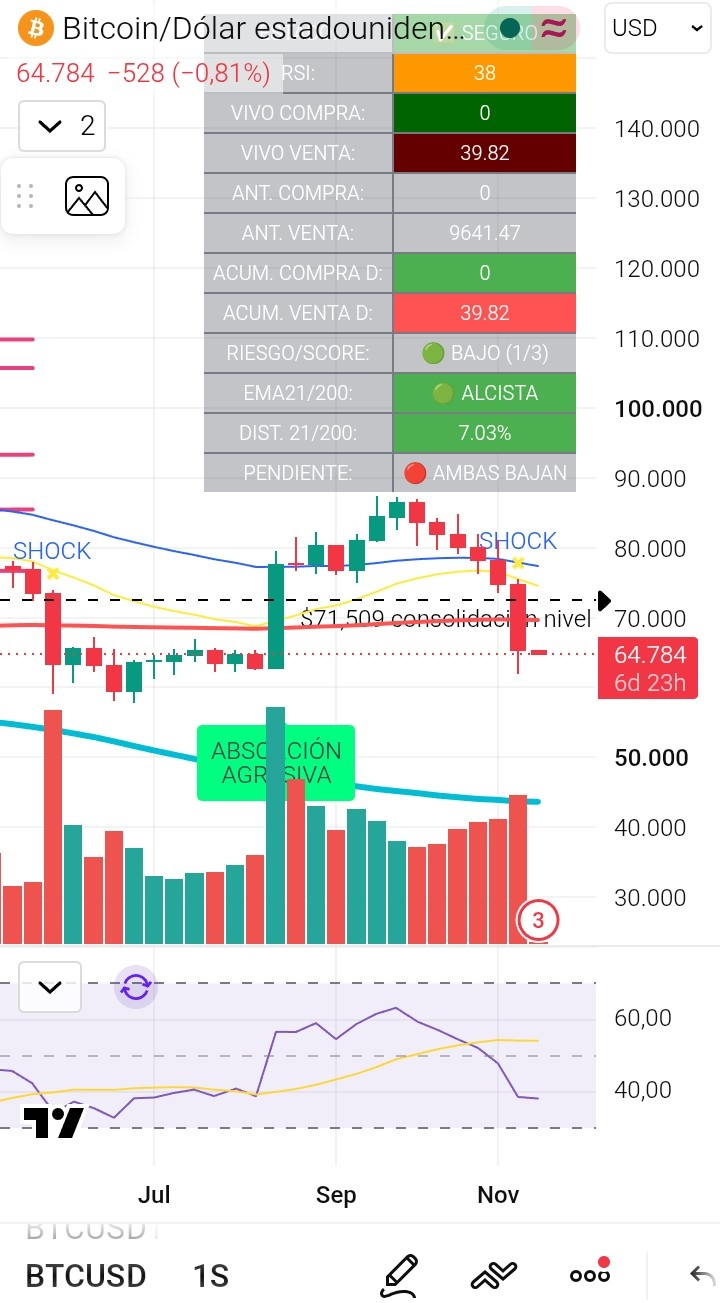
🔴 1. The Weekly Close Verdict: Sixth Week in the RedClosing Price: Bitcoin closed the week around $64,780–$65,300 USD after opening near $74,740 (a weekly decline of approximately 12.6%). Historic Streak: The sixth consecutive negative weekly close is confirmed, breaking below the 200-week simple moving average (~$67,750–$67,920) for the first time during this stretch and closing below the macro barrier of $71,509. Technical Status (1W and 4H):
🟡 Weekly (1W): LOW risk (1/3) with a SHOCK alert active; the macro crossover remains bullish (+7.03%), but the slope warns that both moving averages are falling and the weekly RSI has retreated to 38.
🔴 Intraday (4H): HIGH risk (3/3) and a bearish structure, with a -12.08% gap relative to the moving averages. The 4H RSI is at 32 after touching an extreme low of 18 during the crash.
🌍 2. What Caused the Crash? Hard Market Data
💥 Liquidation Cascade: More than $1.9 billion in leveraged positions were liquidated over the weekend (nearly 88% of them long positions), accelerating the decline after the price fell below $70,000. On-chain data confirms that there was no mass selling by large holders to exchanges, but rather an extreme deleveraging.
📉 Institutional Capital Outflows: Exchange-traded funds (ETFs) have seen nearly $3 billion in outflows since late October, with seven consecutive sessions in the red.
💵 Macroeconomic Pressure: Wholesale inflation (PPI) at 5% is keeping the U.S. dollar (DXY) at its yearly highs and reinforcing expectations of a restrictive stance by the Federal Reserve in December. In addition, the global supply of stablecoins has contracted by $14.2 billion over the past 30 days, draining immediate liquidity.
🎯 3. Key Levels and Price ProjectionsThe market enters the new week caught between short-term reclaimed resistance and critical lower liquidity blocks:
🟢 Ceiling / Structural Recovery ($70,000 – $73,000): First major resistance wall (where the weekly 200 EMA, the former $71,509 support, and the 200-day moving average converge). Only a recovery of this range would invalidate the bearish sequence.
🟡 Immediate Reaction Zone ($67,750 – $67,920): The location of the 200-week simple moving average, the first technical target if a relief bounce occurs.
🟠 Current Consolidation Range ($64,100 – $65,300): Zone where the price is trying to stabilize after absorbing the weekend's blow.
🔴 Critical Weekend Support ($61,900 – $62,600): Low reached during the bearish whipsaw. A 4H candle close below this floor would open the door to another liquidity sweep.
🟣 Deep Liquidity Blocks ($57,750 – $60,000): Zone where the next major block of institutional orders is concentrated, along with the macro anchor at $58,438 (July low and long-term historical support). Note: As an extreme cycle reference, the long-term dynamic floor is much lower, near $44,000.
🛡️ 4. Action Plan for the Community"Sixth consecutive negative weekly close below the 200-week moving average, with no confirmed buy signal. Absolute priority: manage risk."No Heroics in Free Fall: A low RSI indicates oversold conditions, but does not guarantee a definitive bottom. Avoid impulsive entries amid short technical bounces ("relief rallies") without sustained buying volume.Liquidity at the Ready and Patience: For those looking to accumulate over the medium or long term, discipline means waiting for real confirmation of institutional absorption or calmly monitoring the price reaction if it visits the $58,000 – $60,000 zone.Strict Risk Management: If you have short-term trades open, respect your invalidation levels below $61,900 and avoid overleveraging at Monday's institutional open, when ETF flows will set the course for the week.🔔 Question for the community:
With the price closing its sixth week in the red below $65,000 and liquidity blocks pointing toward $58,438 if $61,900 is lost: Do you think $62k support will hold through Monday's institutional open, or are you keeping your liquidity ready to wait for the $58k zone?