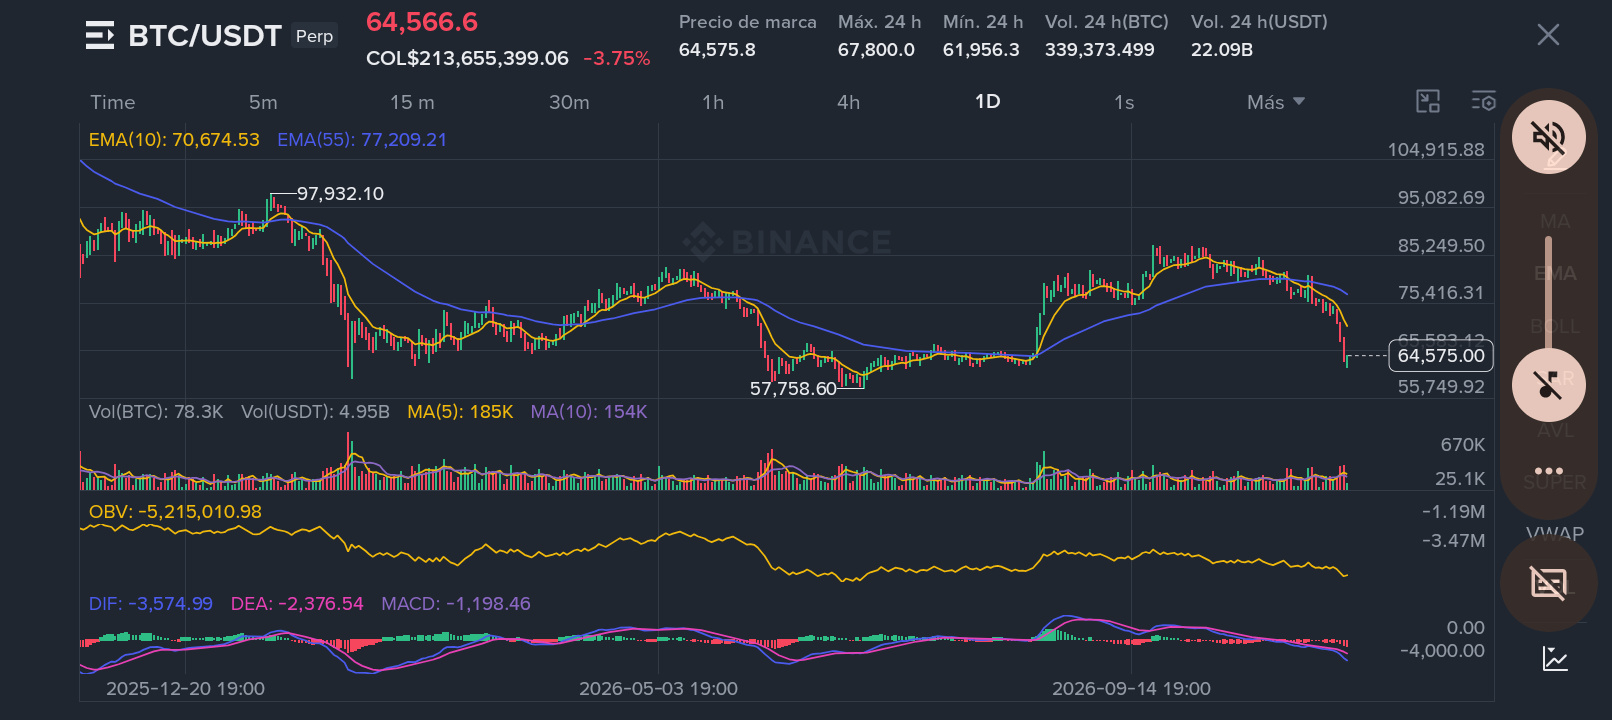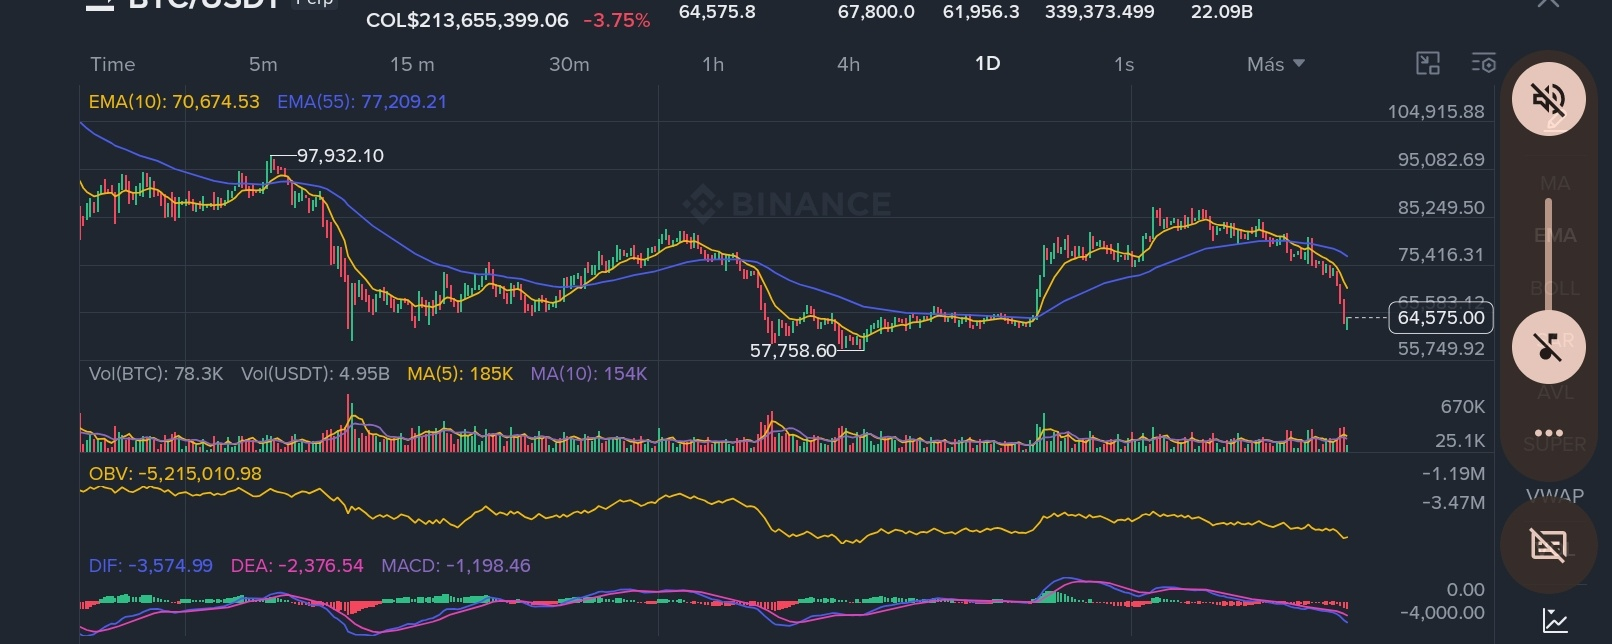

Bitcoin is trading around **64,566 USDT**, down 3.75% over the past 24 hours. However, a look at the daily chart reveals signals that deserve special attention.
### 📉 1. Moving averages confirm weakness
The price is below both exponential moving averages:
- EMA 10: 70,674 USDT.
- EMA 55: 77,209 USDT.
Additionally, the EMA 10 is below the EMA 55. This reflects a bearish structure and shows that, for now, buyers have not managed to regain control.
### 📊 2. The MACD remains in negative territory
The data shows:
- DIF: -3.574.
- DEA: -2.376.
- Histogram: -1.198.
The lines remain in negative territory, and the histogram is also bearish. This indicates that selling momentum continues to dominate and there is still no clear technical recovery signal.
### 🔍 3. The OBV shows weak demand
The OBV indicator continues to trend downward, suggesting that cumulative volume is not showing a convincing recovery in buying pressure.
This signal deserves close attention because a sustainable recovery requires real participation from buyers.
### 🧭 4. Important levels to watch
**Support:**
- 61,956 USDT: low of the past 24 hours.
- 57,758 USDT: zone of a significant previous low.
**Resistance:**
- 70,674 USDT: EMA 10.
- 77,209 USDT: EMA 55.
If Bitcoin loses support at 61,956 USDT and confirms the break on the daily timeframe, selling pressure could increase and open the way toward the 57,758 USDT zone.
Conversely, reclaiming 70,674 USDT would be the first step toward improving the structure.
### 🎯 CONCLUSION: IS IT TIME TO BUY OR WAIT?
For now, the daily chart does not show sufficient conditions to confirm a trend reversal.
Although technical bounces may occur after a significant drop, we should not mistake a bounce for a bullish reversal.
The most prudent strategy is to wait:
1. For the price to find a support zone.
2. For buying volume to appear.
3. For the MACD to begin regaining momentum.
4. For the OBV to stop making lower lows.
5. For Bitcoin to regain its 4H structure before looking for entries on the 1H and 15-minute timeframes.
**A sharp drop does not necessarily mean the bottom is in. In the market, acting too soon can be more costly than waiting for confirmation.**
It’s not about buying because Bitcoin is cheaper, but about identifying when buyers start to regain control.
*Educational technical analysis based on the daily BTC/USDT chart. This is not financial advice.*
### My take
There are three aspects I consider especially important:
* The drop is supported by several indicators: EMA, MACD, and OBV all point downward.
* We have no confirmation of a bottom: we still need to see a recovery in buying volume.
* The next important move: watch how BTC reacts around 61,956 USDT.
My technical recommendation would be not to anticipate a bullish entry yet. I would first review the daily close and then look for confirmation on the 4H timeframe.