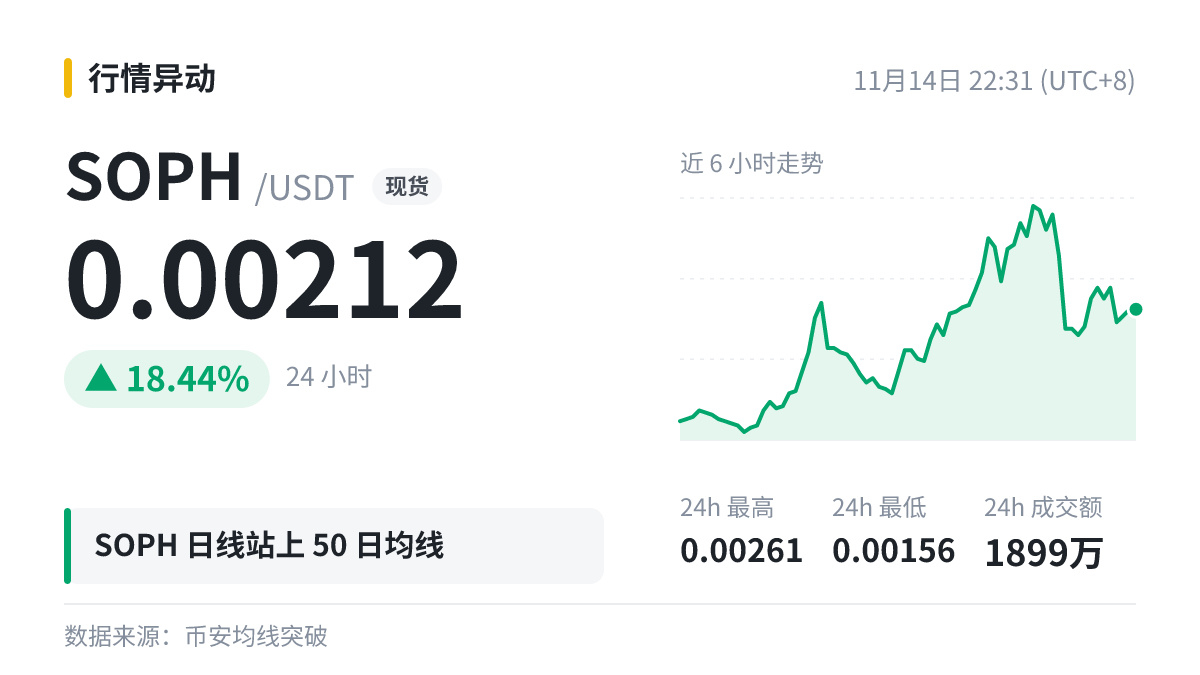
$SOPH The daily chart moved above MA50 (0.002381), but the current price of 0.00212 has fallen back below the moving average.
A beginner’s burning question: How do you read moving averages?
Moving averages are calculated from past prices, so they inherently lag: the longer the period, the smoother the moving average and the slower its response.
A price moving above a long-term moving average is often interpreted as a sign that the trend is improving, while a drop below it is often seen as a sign of weakness—but a single crossover is far from conclusive.
Leave yourself plenty of room when sizing futures positions, and don’t let one sudden price swing knock you out of a trade.
A beginner’s burning question: How do you read moving averages?
Moving averages are calculated from past prices, so they inherently lag: the longer the period, the smoother the moving average and the slower its response.
A price moving above a long-term moving average is often interpreted as a sign that the trend is improving, while a drop below it is often seen as a sign of weakness—but a single crossover is far from conclusive.
Leave yourself plenty of room when sizing futures positions, and don’t let one sudden price swing knock you out of a trade.