“Options priced in only a 5% weekly move, but BTC moved more than 10%—the options market got it wrong again.” This line has been making the rounds on X today. I think it has things backward.
I pulled the data myself:
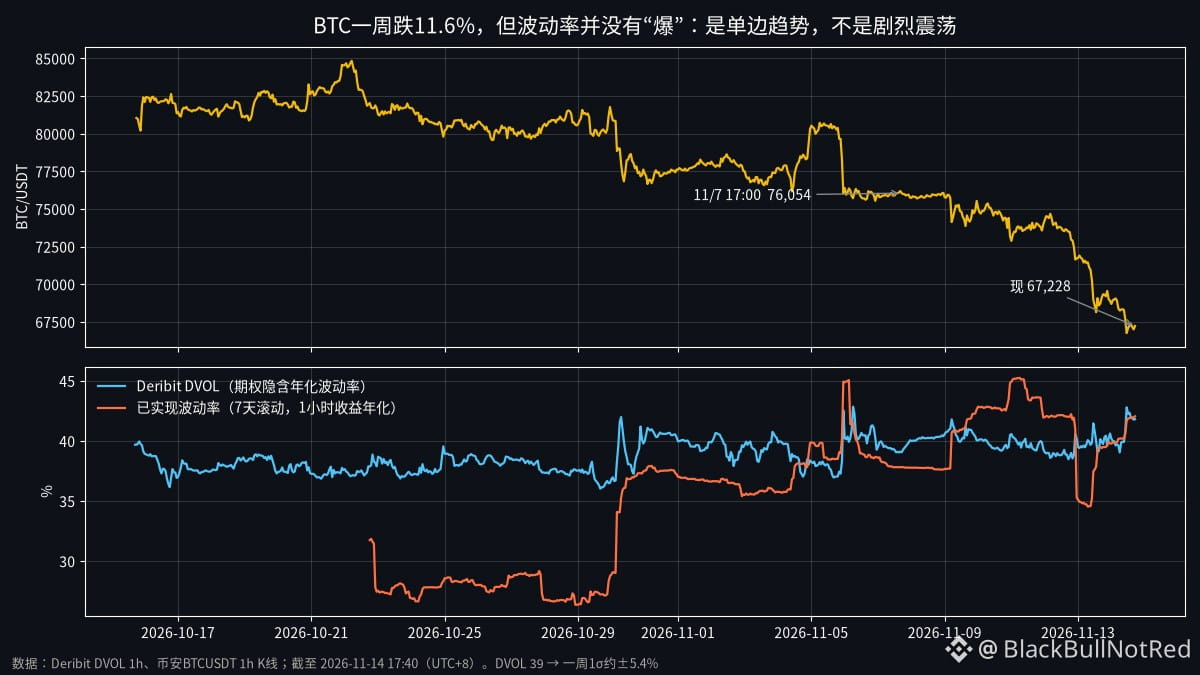
One week ago (11/7 17:00, UTC+8), BTC was at 76,054; now it’s at 67,228, down 11.6%.
At the time, Deribit DVOL was around 39, which translates to roughly ±5.4% for a one-standard-deviation move over a week. So yes, this week’s move was more than twice that many σ.
But look at realized volatility: calculated from 1-hour candles, annualized realized volatility over the past 7 days is about 42%, while DVOL is now 41.8. In other words, options pretty much got the “how much it moves each day” part right. This week wasn’t some wildly volatile, violent market.
The miss wasn’t volatility; it was direction. Each hourly move was nothing extraordinary, but almost every step was down. The steady grind lower added up to -11.6%. Options’ σ assumes moves are random in either direction; it doesn’t account for whether the market will keep moving one way all week.
Who should care about this distinction:
People who sold straddles naked got run over this week and did lose money. But sellers who delta-hedged earn the difference between implied and realized volatility. Those were about the same this week, so they mostly took a small loss or broke even—not the “vol sellers got slaughtered” scenario people imagine.
Conversely, if you’re looking to buy Calls now to catch a rebound, don’t assume panic has pushed volatility up and made options expensive—DVOL is 41.8, in the middle of its 30-day range of 36 to 43. Not cheap, but not outrageous either.
A sharp drop ≠ high volatility. That’s what makes a grinding decline so punishing: there’s no huge red candle to scare you, but your account keeps shrinking.
Data: Deribit DVOL, Binance BTCUSDT 1h candles, as of 11/14 17:40 (UTC+8)
#BTC #Options
I pulled the data myself:
One week ago (11/7 17:00, UTC+8), BTC was at 76,054; now it’s at 67,228, down 11.6%.
At the time, Deribit DVOL was around 39, which translates to roughly ±5.4% for a one-standard-deviation move over a week. So yes, this week’s move was more than twice that many σ.
But look at realized volatility: calculated from 1-hour candles, annualized realized volatility over the past 7 days is about 42%, while DVOL is now 41.8. In other words, options pretty much got the “how much it moves each day” part right. This week wasn’t some wildly volatile, violent market.
The miss wasn’t volatility; it was direction. Each hourly move was nothing extraordinary, but almost every step was down. The steady grind lower added up to -11.6%. Options’ σ assumes moves are random in either direction; it doesn’t account for whether the market will keep moving one way all week.
Who should care about this distinction:
People who sold straddles naked got run over this week and did lose money. But sellers who delta-hedged earn the difference between implied and realized volatility. Those were about the same this week, so they mostly took a small loss or broke even—not the “vol sellers got slaughtered” scenario people imagine.
Conversely, if you’re looking to buy Calls now to catch a rebound, don’t assume panic has pushed volatility up and made options expensive—DVOL is 41.8, in the middle of its 30-day range of 36 to 43. Not cheap, but not outrageous either.
A sharp drop ≠ high volatility. That’s what makes a grinding decline so punishing: there’s no huge red candle to scare you, but your account keeps shrinking.
Data: Deribit DVOL, Binance BTCUSDT 1h candles, as of 11/14 17:40 (UTC+8)
#BTC #Options