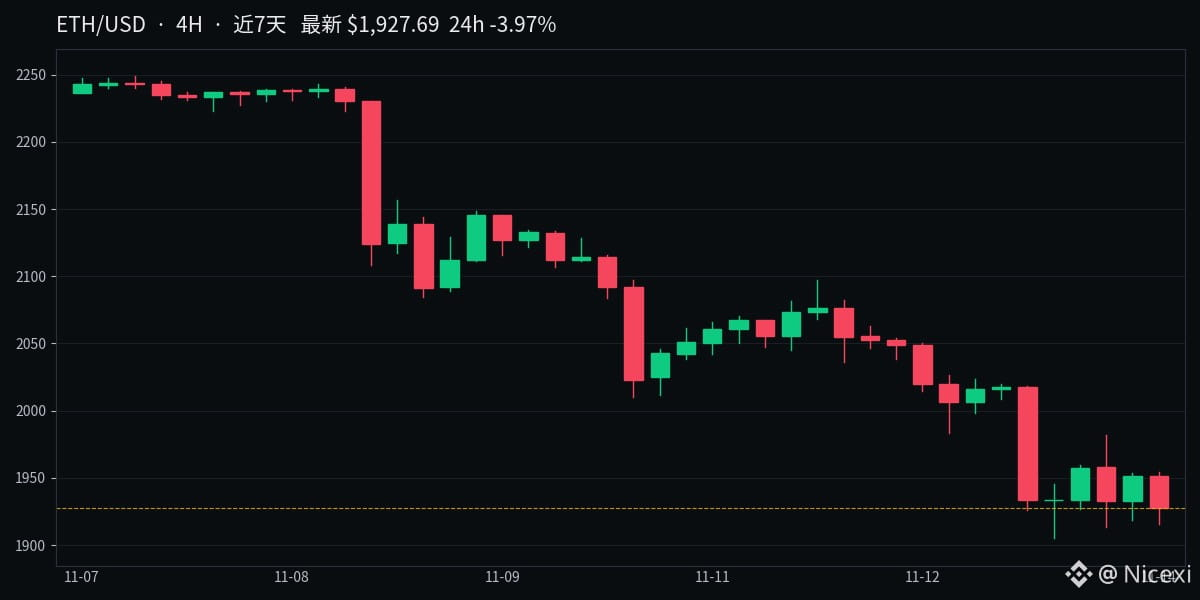
#以太坊 Today’s chart has every indicator screaming oversold, but don’t rush to buy the dip.
ETH is now at $1,924, down 4.1% in 24 hours. The RSI (14) has fallen to 21.9, entering oversold territory. The MACD death cross is still heading lower, with the histogram at -4.5 and bearish momentum showing no signs of easing. The moving averages are also in a bearish alignment: MA7 at 1,950 is below MA25 at 2,030, while the price has been hugging the lower Bollinger Band at 1,909.
What’s interesting is the volume: the daily average over the past three days was $13.2 billion, more than 30% higher than the $9.7 billion over the previous four days. Volume has picked up during the decline—it’s not a slow drop on shrinking volume.
Two possible scenarios: if it holds around 1,909, an oversold bounce could first target the Bollinger midline at 2,014, then MA25 at 2,030. But if the seven-day low at 1,905 doesn’t hold, there’s little obvious support below.
$ETH
ETH is now at $1,924, down 4.1% in 24 hours. The RSI (14) has fallen to 21.9, entering oversold territory. The MACD death cross is still heading lower, with the histogram at -4.5 and bearish momentum showing no signs of easing. The moving averages are also in a bearish alignment: MA7 at 1,950 is below MA25 at 2,030, while the price has been hugging the lower Bollinger Band at 1,909.
What’s interesting is the volume: the daily average over the past three days was $13.2 billion, more than 30% higher than the $9.7 billion over the previous four days. Volume has picked up during the decline—it’s not a slow drop on shrinking volume.
Two possible scenarios: if it holds around 1,909, an oversold bounce could first target the Bollinger midline at 2,014, then MA25 at 2,030. But if the seven-day low at 1,905 doesn’t hold, there’s little obvious support below.
$ETH