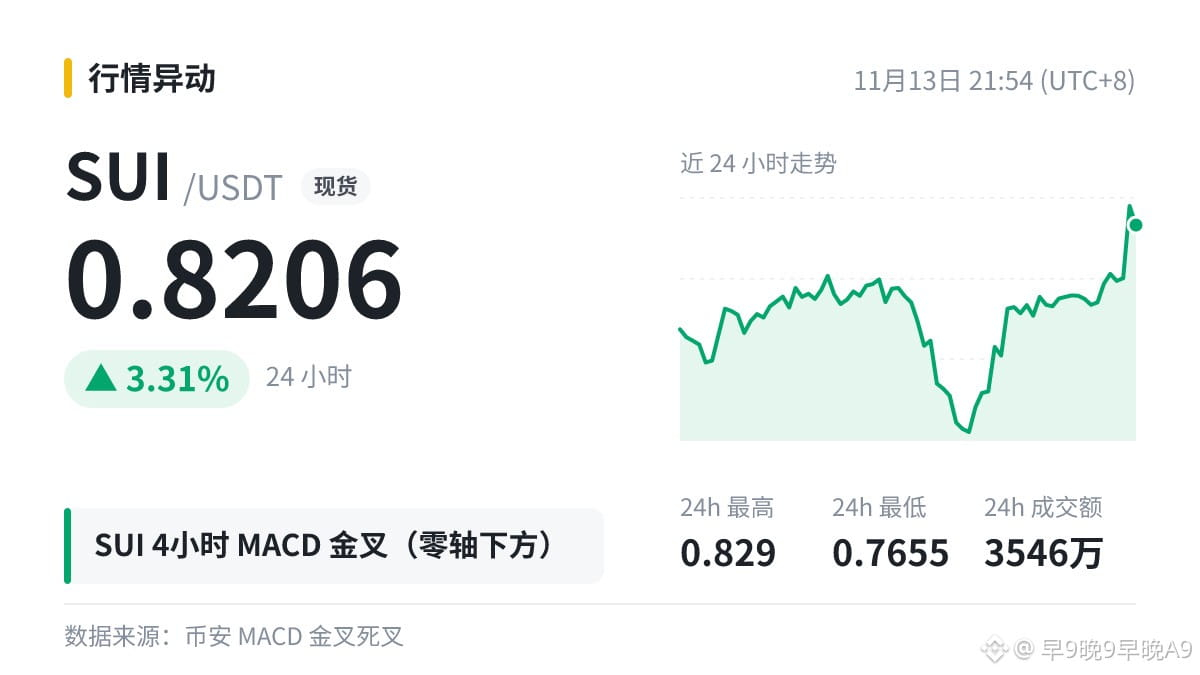
🐋 $SUI 4 hours MACD forms a golden cross below the zero line, with opposing histogram bars persisting for 7 bars before the cross.
Golden and death crosses are everywhere; what matters is where the crossover occurs and the price action leading up to it.
MACD was developed by Gerald Appel. Its default settings are 12, 26, and 9, and it measures price momentum based on the distance between the fast and slow EMAs.
Many people compare different timeframes: when the trend on the higher timeframe hasn’t changed, an opposite crossover on the lower timeframe is often just a correction or a rebound.
All data merely describes what has already happened in the market; at any moment, the market could move in the opposite direction.
Golden and death crosses are everywhere; what matters is where the crossover occurs and the price action leading up to it.
MACD was developed by Gerald Appel. Its default settings are 12, 26, and 9, and it measures price momentum based on the distance between the fast and slow EMAs.
Many people compare different timeframes: when the trend on the higher timeframe hasn’t changed, an opposite crossover on the lower timeframe is often just a correction or a rebound.
All data merely describes what has already happened in the market; at any moment, the market could move in the opposite direction.