

Long time no see. Enough small talk—let’s get straight to the good stuff.
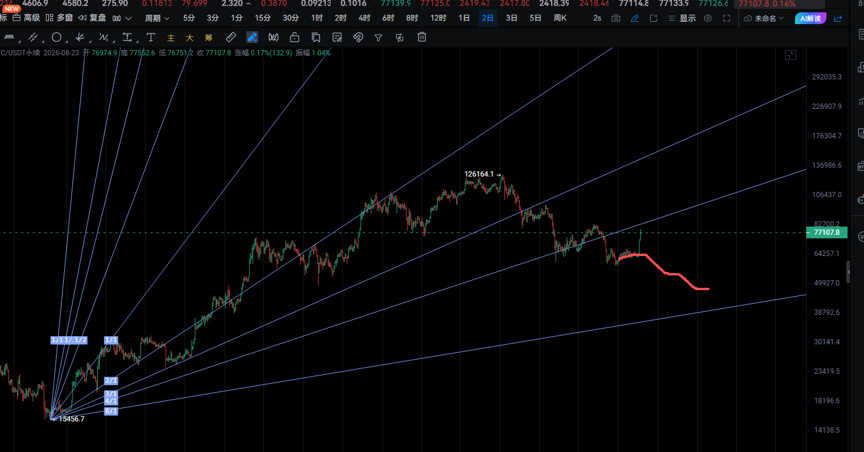
Looking at this Gann major trend angle line, further downside is normal.
However, accurately projecting market movements requires using multiple indicators.
It requires multi-dimensional, diversified confluence, along with careful assessment of the situation and trial and error in trading.
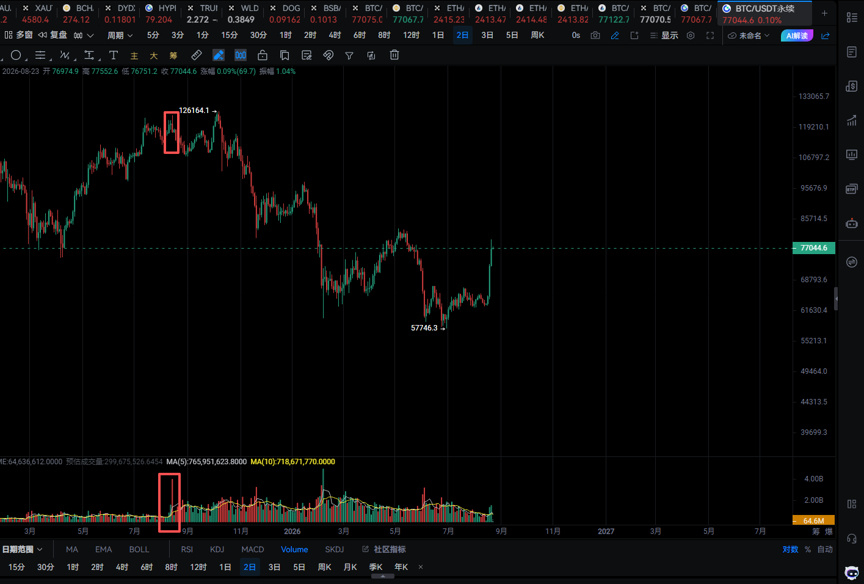
After market-wide volume surged to an exceptionally high level at the top in August 2025 and stayed there for some time, the price made a new high. It then immediately reversed and headed down. During this period, historical volume remained elevated overall.
In February 2026, exceptionally strong buying support appeared again at the bottom, signaling that a bottom may be forming. After four months of continued sideways movement, the price made a new low and then rebounded into a choppy range. Then, following multiple points of confluence between Bitcoin and Ethereum, we saw the explosive bullish candle a few days ago.
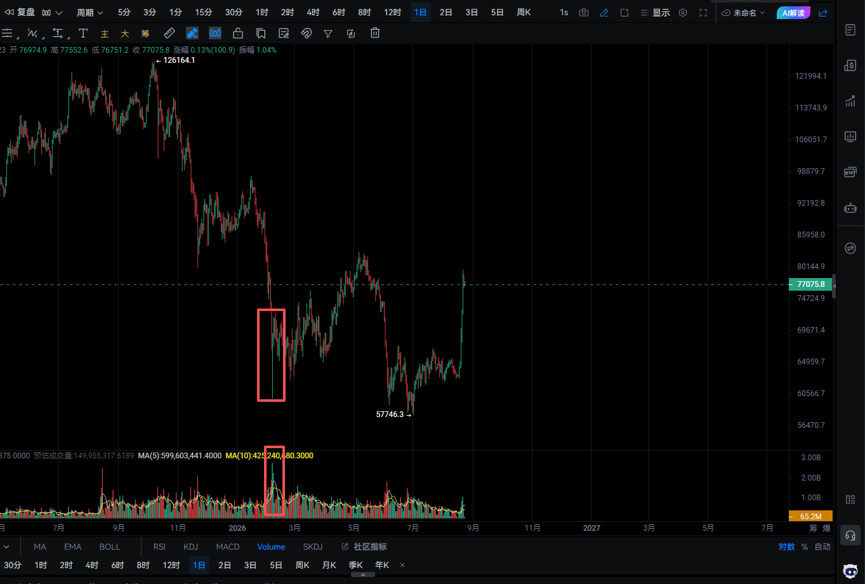
What we're discussing here is the signal from volume.
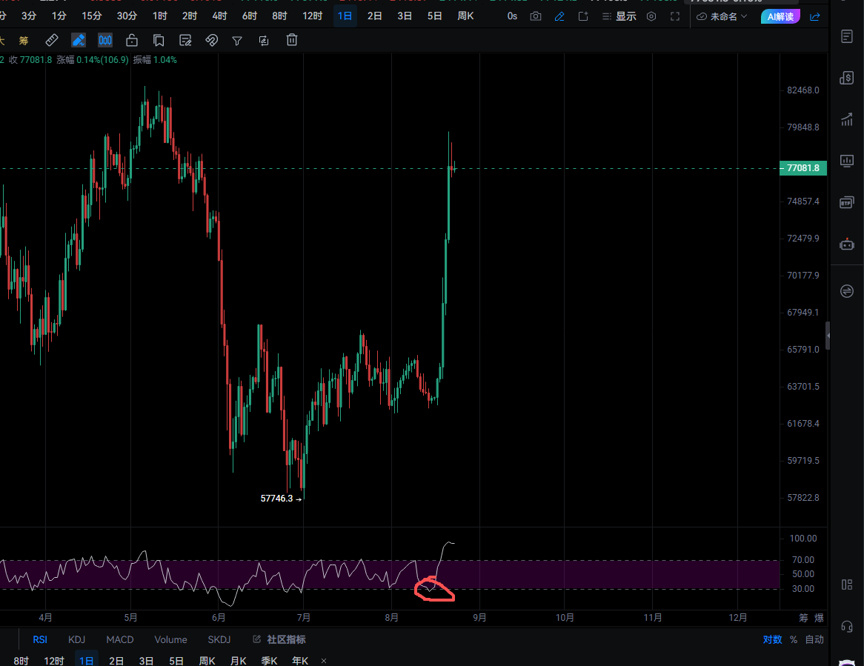
The daily RSI is below 30. That's a buy signal. Bitcoin's RSI is fairly reliable.
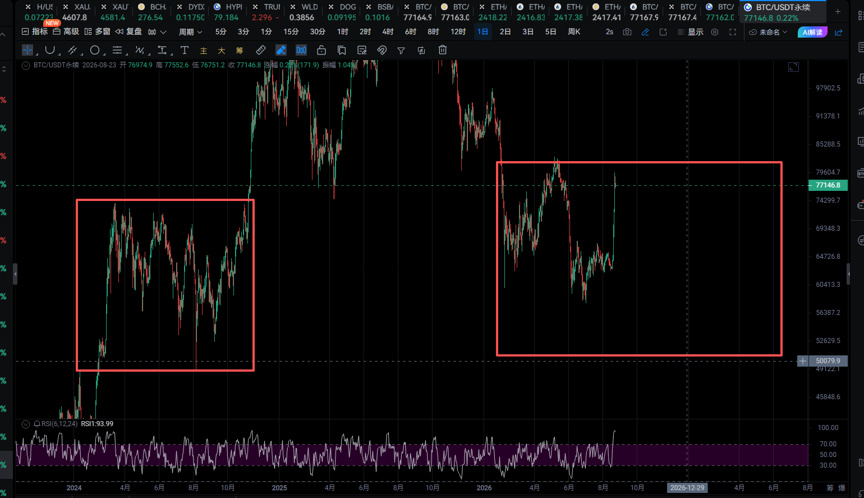
Earlier, when the market fell to around 577, my subjective view was bearish, and I expected a bottom above 4.9. The left side is the future right side, and the right side is the future left side. This mindset can only be used to make predictions. But to determine what will actually happen, we still need to use the pattern structure and the natural course of things to refine our view.
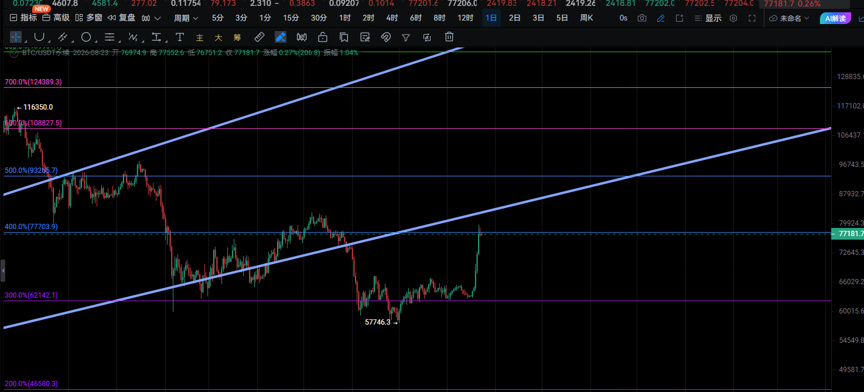
This is the greatest energy in the universe—the force of nature.
Its energy needs no further explanation; just look at its historical trend.
Next is the pattern structure.
First, volume is showing signs of bottoming out. Second, the daily RSI is already at a low level. Furthermore, the market has stabilized above 620 and gained the support of cosmic energy. On top of that, the market has gone through a downtrend followed by a period of sideways consolidation. At this point, you must change your mindset and stop expecting further declines. Shift your view to a trend reversal.
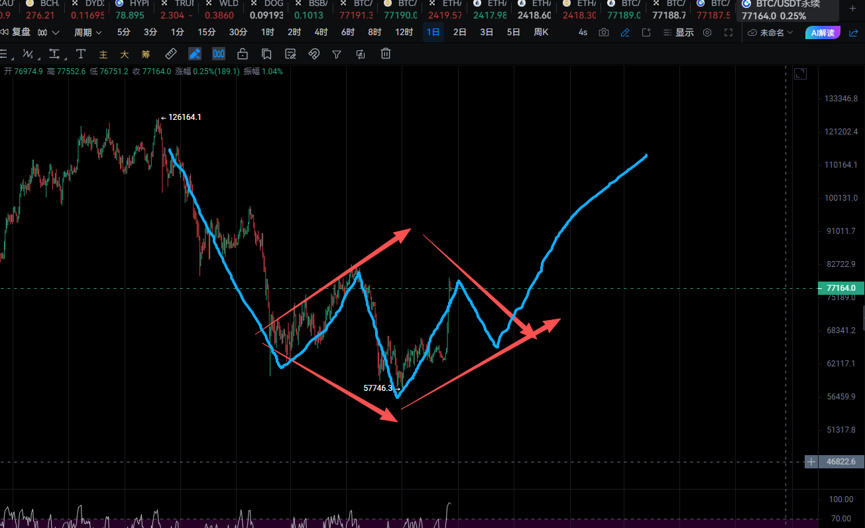
Make your prediction first, then follow the trend. My current prediction is that this is a diamond-bottom pattern—in other words, a left shoulder bottom, a head-and-shoulders bottom, and a right shoulder bottom.
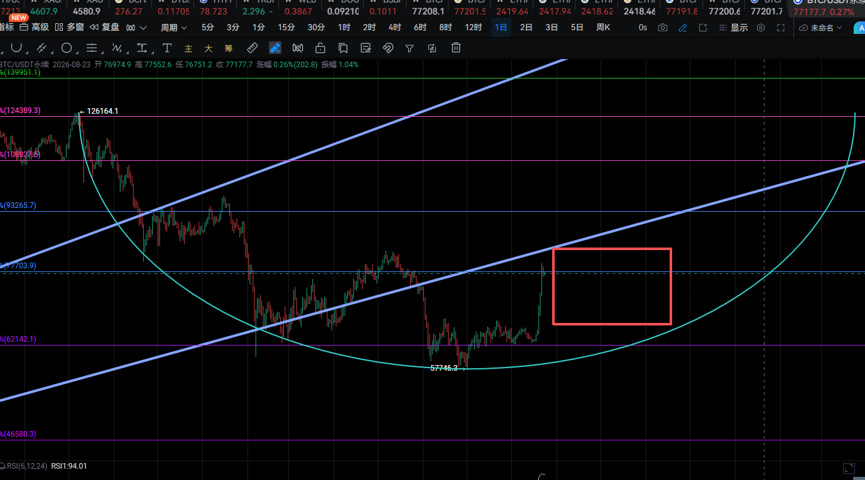
If the market is currently forming a bottom, it may still need to pull back and form a right shoulder, because the bottoming pattern isn't rounded enough in either time or shape. It needs a pullback, or it could wait out the decline through sideways movement. But the resistance above is at 775, under immense cosmic pressure. Also, from a structural perspective, forming a right shoulder is perfectly reasonable. So just wait patiently. You can scale in on pullbacks to 69, 72, and 74. Once you're in, just hold your position.
Then let's continue with the review.
Switching to the 6-hour chart, this rally in Bitcoin was foreseeable. First, on the lower time frame, the market makers formed a rounded top. But the key detail is that the force of nature—cosmic energy at 62,000—was never broken. After time-and-price fluctuations, the market gradually broke free of the rounded-top resistance and surged violently. Now let's switch to Ethereum's perspective and see what it's doing.
Ethereum was the first to break free of the rounded-top resistance. It retested the upper trendline of the rounded top, then continued to consolidate while waiting for a signal from Bitcoin.
Before that, on the technical side, MACD, SKDJ, and KDJ all gave signals. SKDJ gave a golden cross on 8/15, KDJ gave one on 8/17, and MACD gave one on 8/18.
So, going back to the beginning.
But to accurately project the market's likely movements, you need to use multiple indicators.
It takes a multi-dimensional, diversified confluence of signals. You need to assess the situation and test your ideas through trading.
Let's talk about the future.
The yellow resistance line circled in blue is being tested for the first time. Usually, price can't break through on the first attempt. It needs to pull back and build momentum before trying again.
The area circled in yellow shows the potential range of a future pullback. The bottoming pattern isn't sufficiently developed in time or shape, and the rounded bottom isn't smooth enough. It already aligns with an inverted diamond pattern and a right shoulder bottom, so just wait patiently.
According to this chart, support for the upward move is around 694, but the level may change as price fluctuates over time. We'll discuss it when the time comes.
On this chart, support is around 666, but the level may change as price fluctuates over time. We'll discuss it when the time comes.
On this chart, support is around 715, but the level may change as price fluctuates over time. We'll discuss it when the time comes.
The historical, very-long-term uptrend line has been reclaimed—that's the white line. The current price is 707.
So, in summary: if it pulls back to 715 later, you can consider going long. I don't know where to place the stop-loss, because I'm absolutely certain a new bull market has begun. 69, 66, 70,000, or 715 are all levels where you can go long. I only recommend using low leverage and scaling in. That's it, bye.