$BTC tests the week's support: what to watch now 📊
SITUATION
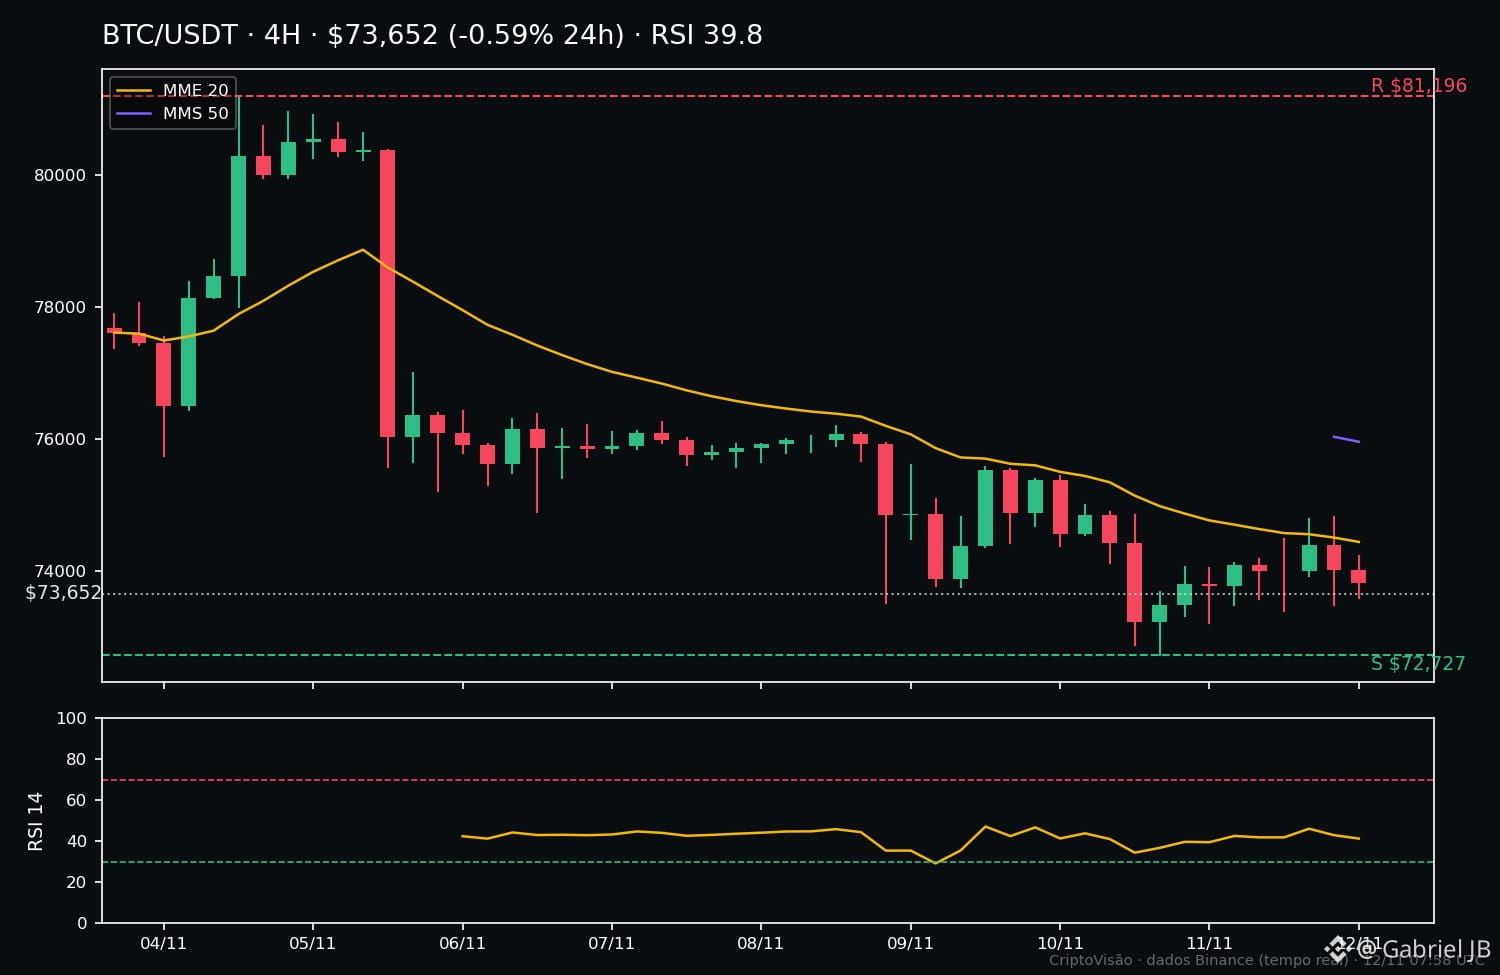
The $BTC is at $73,652 this Thursday (12/11, ~10:00 CAT), down 0.6% over the past 24 hours and 4.9% over the past 7 days. The price is sitting at the week's low and below the 20- and 50-period moving averages on the 4-hour chart — the short-term trend remains fragile, but the RSI-14 is at 39.8, in neutral territory, not oversold.
LEVELS
• Support: $72,727 (7-day low)
• Resistance: $74,305 (20-period moving average) and $75,956 (50-period moving average)
• Weekly high: $81,196
SCENARIO A — support holds
If the price defends $72,727 and a 4-hour candle closes above this level, it could open the way for a recovery toward $74,305 and then $75,956.
SCENARIO B — support fails
If a 4-hour candle closes below $72,727, the recovery scenario loses strength and selling pressure could pick up, with the market looking for new levels lower down.
WHAT WOULD CONFIRM IT
Only the 4-hour candle close counts — a wick below support without a close below it confirms nothing. A second close above the level would strengthen this view.
RISK
Buying right at support in a downtrend is risky: a break below this level could accelerate the decline. Risk management comes first — size your position appropriately and set a stop before entering.
CONCLUSION
The $BTC is at a decision point: $72,727 is the line separating a recovery attempt from a continued decline. What do you think — will support hold or give way?
#Bitcoin #CryptoVision
SITUATION
The $BTC is at $73,652 this Thursday (12/11, ~10:00 CAT), down 0.6% over the past 24 hours and 4.9% over the past 7 days. The price is sitting at the week's low and below the 20- and 50-period moving averages on the 4-hour chart — the short-term trend remains fragile, but the RSI-14 is at 39.8, in neutral territory, not oversold.
LEVELS
• Support: $72,727 (7-day low)
• Resistance: $74,305 (20-period moving average) and $75,956 (50-period moving average)
• Weekly high: $81,196
SCENARIO A — support holds
If the price defends $72,727 and a 4-hour candle closes above this level, it could open the way for a recovery toward $74,305 and then $75,956.
SCENARIO B — support fails
If a 4-hour candle closes below $72,727, the recovery scenario loses strength and selling pressure could pick up, with the market looking for new levels lower down.
WHAT WOULD CONFIRM IT
Only the 4-hour candle close counts — a wick below support without a close below it confirms nothing. A second close above the level would strengthen this view.
RISK
Buying right at support in a downtrend is risky: a break below this level could accelerate the decline. Risk management comes first — size your position appropriately and set a stop before entering.
CONCLUSION
The $BTC is at a decision point: $72,727 is the line separating a recovery attempt from a continued decline. What do you think — will support hold or give way?
#Bitcoin #CryptoVision