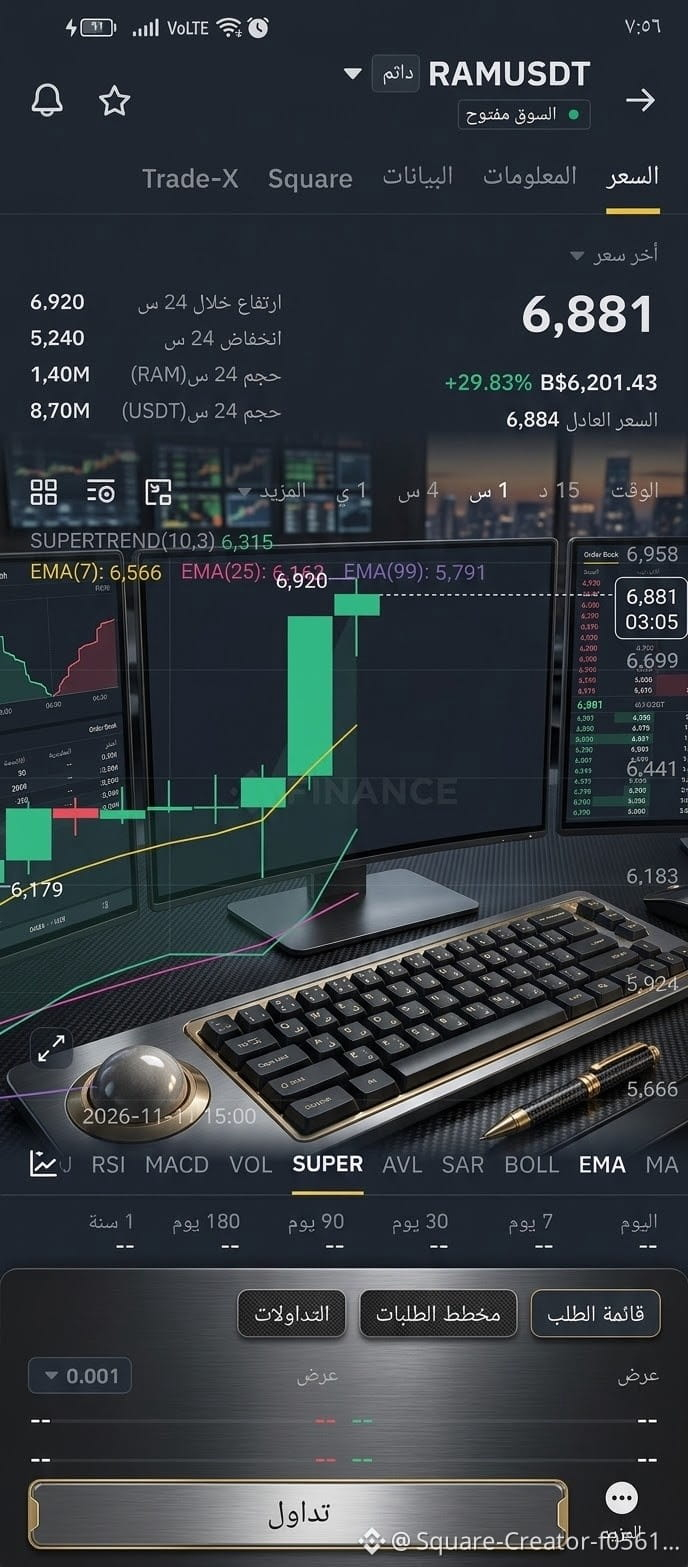
$RAM Here is a brief analysis of the RAMUSDT (perpetual contracts) chart:
1. Current situation and price
* Current price: $6.881.
* 24-hour change: A very strong increase of +29.83%.
* 24-hour high: 6.920.
* 24-hour low: 5.240.
2. Technical indicators
* Price trend (Supertrend): Gives a bullish signal at 6.315.
* Moving averages (EMA):
* EMA(7): 6.566 (very nearby support).
* EMA(25): 6.162.
* EMA(99): 5.791 (strong overall uptrend).
* All moving averages are trending upward and moving below the price candles, confirming a strong rise and positive momentum.
3. Key levels
* Current resistance level: 6.920 (the peak of the latest rally; breaking above it could open the way for further gains).
* Key support levels:
* First support: 6.566 (EMA 7 level).
* Second support: 6.315 (Supertrend indicator level).
💡 Summary and advice
* Overall trend: Very strong upward trend on the medium and short timeframes.
* Caution: After the rapid, significant rise (+29.83%), the likelihood of a minor correction or profit-taking increases. Therefore, it is preferable not to buy directly at the top and to wait for a retest of support levels (such as 6.56–6.31), while taking partial profits if you entered earlier.
1. Current situation and price
* Current price: $6.881.
* 24-hour change: A very strong increase of +29.83%.
* 24-hour high: 6.920.
* 24-hour low: 5.240.
2. Technical indicators
* Price trend (Supertrend): Gives a bullish signal at 6.315.
* Moving averages (EMA):
* EMA(7): 6.566 (very nearby support).
* EMA(25): 6.162.
* EMA(99): 5.791 (strong overall uptrend).
* All moving averages are trending upward and moving below the price candles, confirming a strong rise and positive momentum.
3. Key levels
* Current resistance level: 6.920 (the peak of the latest rally; breaking above it could open the way for further gains).
* Key support levels:
* First support: 6.566 (EMA 7 level).
* Second support: 6.315 (Supertrend indicator level).
💡 Summary and advice
* Overall trend: Very strong upward trend on the medium and short timeframes.
* Caution: After the rapid, significant rise (+29.83%), the likelihood of a minor correction or profit-taking increases. Therefore, it is preferable not to buy directly at the top and to wait for a retest of support levels (such as 6.56–6.31), while taking partial profits if you entered earlier.