


Bullish BiasResistance Zone
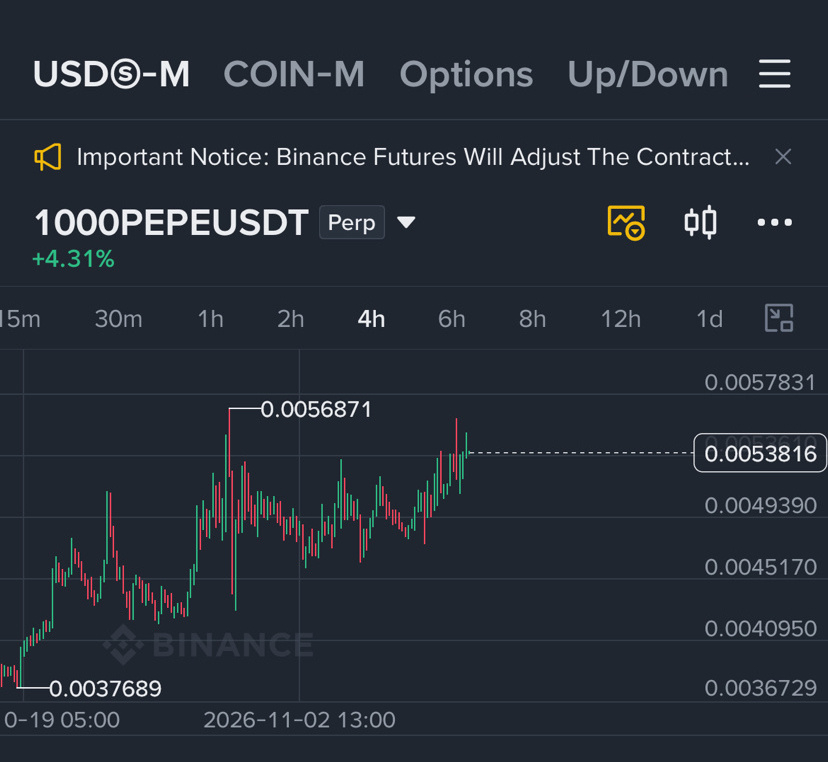
Based on your Binance Futures screenshot, 1000PEPEUSDT is showing a short-term bullish structure on the 4-hour chart. However, the price is approaching an important resistance area where selling pressure could increase.
1. Market Overview
Indicator
Value
Trading Pair
1000PEPEUSDT
Current Price
0.0053816
Displayed Price Change
+4.31%
Timeframe
4 Hours
Recent Chart High
0.0056871
Recent Chart Low
0.0037689
Funding Rate
0.01000%
Selected Leverage
20x
2. Technical Trend Analysis
The 4-hour chart shows a recovery from the previous low of 0.0037689.
The price gradually moved upward and reached a high of 0.0056871. After that, the market experienced a correction and entered a consolidation phase.
Recently, buyers have started pushing the price upward again.
Current Market Structure:
Short-term trend: Bullish.
Buying momentum: Improving.
Market structure: Higher recovery attempts.
Resistance pressure: Increasing.
Breakout confirmation: Not yet established.
3. Major Resistance Levels
Resistance Zones
Resistance
Price
R1
0.0055000
R2
0.0056871
R3
0.0057831
Bullish Outlook:
If 1000PEPEUSDT successfully breaks above 0.00550 and closes a strong 4-hour candle above this level, the next potential target could be 0.0056871.
A confirmed breakout above the previous high could create additional upward momentum.
4. Major Support Levels
Support Zones
Support
Price
S1
0.0051700
S2
0.0049390
S3
0.0045170
S4
0.0040950
S5
0.0037689
If the price falls below 0.00517, selling pressure could increase, potentially bringing the market toward 0.0049390.
5. Bullish and Bearish Scenarios
Bullish Scenario
Positive
If buyers maintain control and the price breaks above 0.00550, the market could move toward 0.0056871.
A successful breakout and retest would strengthen the bullish outlook.
Bearish Scenario
Negative
If the price loses support at 0.00517, a correction toward 0.0049390 becomes possible.
A further breakdown could expose the 0.0045170 support zone.
6. Order Book Analysis
The order book in your screenshot shows:
Red levels represent sell orders.
Green levels represent buy orders.
Current displayed market price is approximately 0.0053816.
Several sell orders are visible around 0.0053820 and above.
Buy orders are also present below the current price.
This indicates active trading on both sides. However, an order book snapshot cannot independently confirm the next market direction.
7. Market Outlook
Factor
Assessment
4H Trend
Bullish
Buying Momentum
Improving
Immediate Resistance
0.00550
Immediate Support
0.00517
Major Resistance
0.0056871
Overall Bias
Cautiously Bullish
8. Final Conclusion
Bullish Bias
1000PEPEUSDT is showing signs of recovery, with buyers attempting to regain control of the market.
The most important level to watch is 0.00550. A confirmed 4-hour breakout above this resistance could open the way toward 0.0056871.
However, failure to hold 0.00517 could lead to another downward correction.
Key Strategy Observation: Wait for breakout confirmation, trading volume, and a successful retest rather than relying on a single bullish candle.
Risk Disclaimer: Your screenshot shows 20x leverage and Cross Margin. Futures trading carries substantial risk, and high leverage can magnify losses significantly. This analysis is educational, not a guaranteed trading signal.
Note: This analysis uses the screenshot provided, not live market data.

#CanNvidiaEarningsEaseMarketConcerns? #BitcoinFiveWeeklyLosses