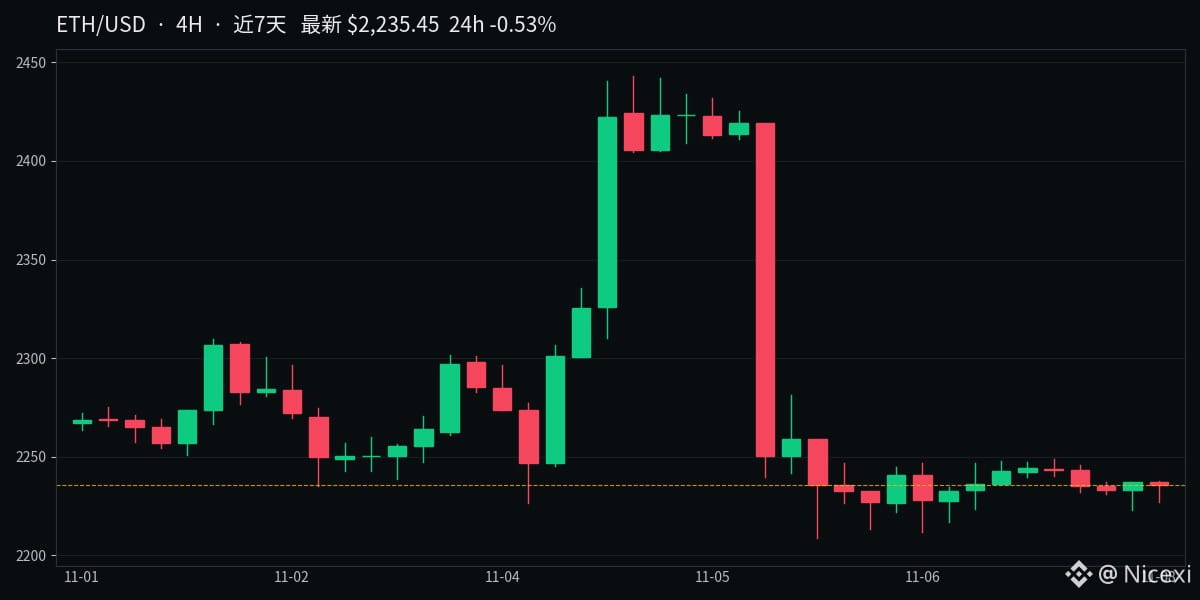
#以太坊 has been hovering around the 2210 line these past few days, with $ETH still there. The current price is 2235, and it is only a step away from the 7-day low of 2208.
2210 is not a line drawn casually. In the past three days, the lows at 2213, 2211, 2216, and 2223 have been tested back and forth several times without breaking. Above, the 2245-2250 area is the same: it has been pushed up four or five times, only to be forced back down each time, and the 2247-2248 area is under very heavy pressure.
The indicators also do not look good. RSI at 36.9 is close to the oversold zone, MACD is still in a bearish crossover, the MA25 moving average is pressing at 2288, and price is trading in the lower half of the Bollinger Bands, so the short-term structure is just a weak sideways consolidation.
There are two possible paths: if it holds above 2210, first look at 2248, then at the Bollinger midline at 2275; if 2208 is decisively broken by a 4-hour candlestick, then there will be no decent support below, and attention will turn to the 2130 area.
2210 is not a line drawn casually. In the past three days, the lows at 2213, 2211, 2216, and 2223 have been tested back and forth several times without breaking. Above, the 2245-2250 area is the same: it has been pushed up four or five times, only to be forced back down each time, and the 2247-2248 area is under very heavy pressure.
The indicators also do not look good. RSI at 36.9 is close to the oversold zone, MACD is still in a bearish crossover, the MA25 moving average is pressing at 2288, and price is trading in the lower half of the Bollinger Bands, so the short-term structure is just a weak sideways consolidation.
There are two possible paths: if it holds above 2210, first look at 2248, then at the Bollinger midline at 2275; if 2208 is decisively broken by a 4-hour candlestick, then there will be no decent support below, and attention will turn to the 2130 area.