$ONE
/USDT – Is Harmony Preparing for a Bigger Breakout?
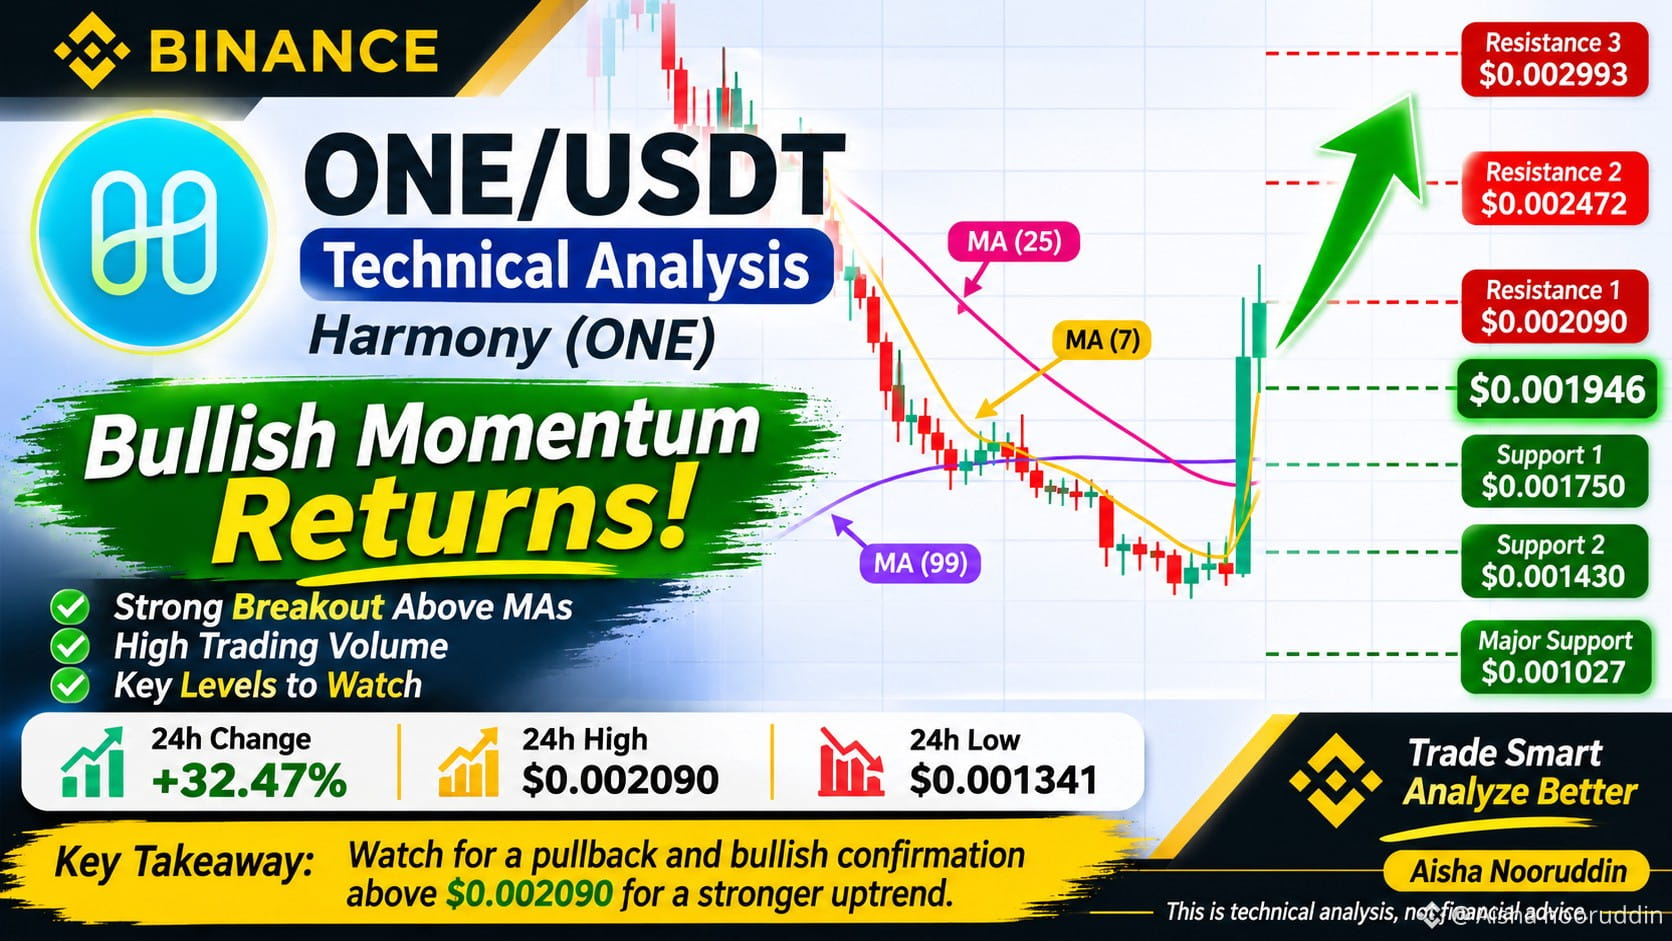
Harmony (ONE) is attracting attention after a strong 32.47% daily price increase. After a prolonged downtrend, the chart is showing signs of a possible bullish recovery.
The most interesting part of this move is the sudden increase in trading volume, suggesting that buyers have entered the market with strong momentum.
# Key Technical Observations
* Current Price: $0.001946
* 24H High: $0.002090
* 24H Low: $0.001341
* Daily Change: +32.47%
* Volume: Significant increase in buying activity.
Important Support & Resistance Levels
| Support Levels | Resistance Levels
| $0.001750 | $0.002090
| $0.001430 | $0.002472
| $0.001027 | $0.002993
What Could Happen Next?
$ONE is currently trading above its major moving averages, which is an encouraging development.
However, after such a strong rally, a short-term pullback or consolidation would not be surprising.
If buyers manage to defend the $0.00175–$0.00189 zone, another attempt toward $0.002090 could become possible.
A confirmed daily close above $0.002090 may open the door toward the next resistance around $0.002472.
On the other hand, losing nearby support could weaken the bullish structure.
My Trading Perspective
I would avoid chasing the current green candle. Waiting for a healthy retest and confirmation may offer a more disciplined approach.
The key question is: Can $ONE maintain this momentum, or will sellers step in after the sharp rally?
What is your opinion on Harmony (ONE)? Are you bullish or waiting for a better entry?
#ONE #Harmony #CryptoAnalysis #TechnicalAnalysis #BinanceSquare
/USDT – Is Harmony Preparing for a Bigger Breakout?
Harmony (ONE) is attracting attention after a strong 32.47% daily price increase. After a prolonged downtrend, the chart is showing signs of a possible bullish recovery.
The most interesting part of this move is the sudden increase in trading volume, suggesting that buyers have entered the market with strong momentum.
# Key Technical Observations
* Current Price: $0.001946
* 24H High: $0.002090
* 24H Low: $0.001341
* Daily Change: +32.47%
* Volume: Significant increase in buying activity.
Important Support & Resistance Levels
| Support Levels | Resistance Levels
| $0.001750 | $0.002090
| $0.001430 | $0.002472
| $0.001027 | $0.002993
What Could Happen Next?
$ONE is currently trading above its major moving averages, which is an encouraging development.
However, after such a strong rally, a short-term pullback or consolidation would not be surprising.
If buyers manage to defend the $0.00175–$0.00189 zone, another attempt toward $0.002090 could become possible.
A confirmed daily close above $0.002090 may open the door toward the next resistance around $0.002472.
On the other hand, losing nearby support could weaken the bullish structure.
My Trading Perspective
I would avoid chasing the current green candle. Waiting for a healthy retest and confirmation may offer a more disciplined approach.
The key question is: Can $ONE maintain this momentum, or will sellers step in after the sharp rally?
What is your opinion on Harmony (ONE)? Are you bullish or waiting for a better entry?
#ONE #Harmony #CryptoAnalysis #TechnicalAnalysis #BinanceSquare