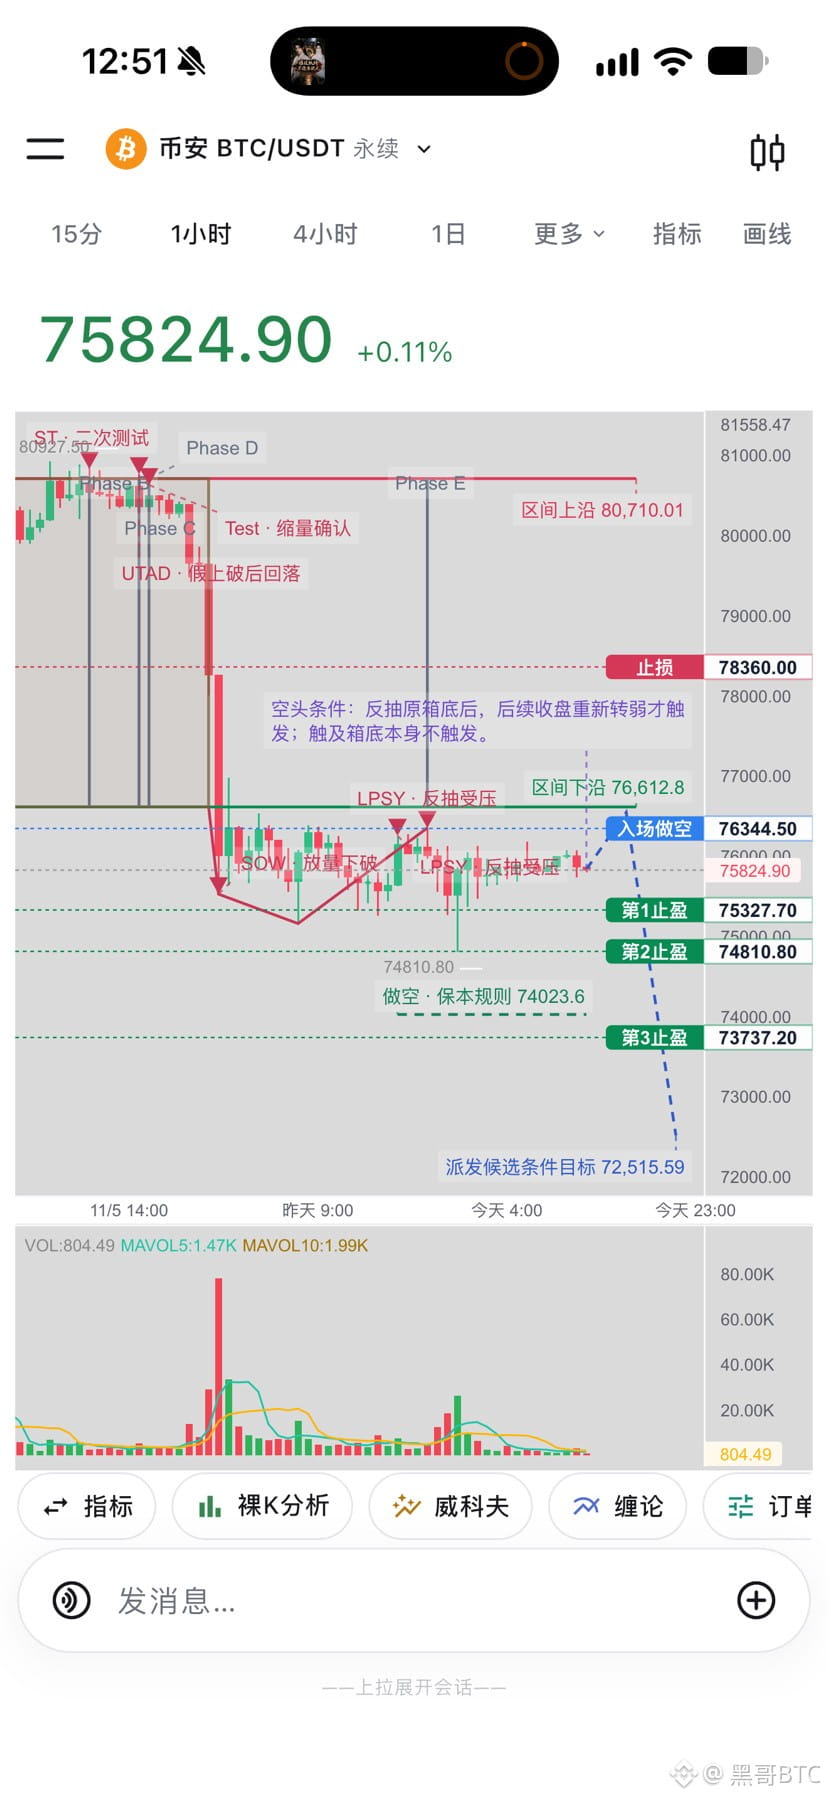

$BTC Bitcoin is currently undergoing a weak, choppy rebound after a sharp drop. The overall market structure leans bearish, and bullish momentum appears relatively weak during the rebound. As for your talk of a bull market returning and prices surging, I don’t know whether you’re just guessing or actually have some confirmed information. Retail traders have only just been caught out—why would the price recover so quickly? On the daily chart, while the bears are in control, have you bulls even seen a bottoming consolidation?
Looking at the candlestick pattern, this rebound has come on declining volume, and the price has encountered clear resistance around 76344. This indicates considerable selling pressure overhead, with bulls lacking the momentum to keep pushing prices higher. The note in the chart below—“Bearish condition: After the rebound reaches the bottom of the original range, the signal is triggered only if subsequent closes weaken again”—is very much in line with the technical analysis principle of “role reversal” (a support level becomes resistance after being broken).
The volume indicator at the bottom shows extremely large red volume bars during the earlier plunge (panic selling / major players offloading). During the recent rebound, however, volume has contracted noticeably (a low-volume bounce), indicating weak buying interest. The current rise is merely a recovery after being oversold, not a reversal.
Here is the trading plan:
Entry zone: 76344 (near the current price, at rebound resistance).
Stop-loss: 78570 (placed above the lower boundary of the original range and the recent rebound high; the risk-management rationale is sound and the risk is controllable).
Take-profit targets: Take profits in three stages at 75000, 73785, and 72515. This is a prudent strategy for securing gains in stages.
Break-even rule: After reaching the first take-profit level of 75000, it is recommended to move the stop-loss down to the entry price (break-even). This is an excellent capital-management habit.
Looking at the candlestick pattern, this rebound has come on declining volume, and the price has encountered clear resistance around 76344. This indicates considerable selling pressure overhead, with bulls lacking the momentum to keep pushing prices higher. The note in the chart below—“Bearish condition: After the rebound reaches the bottom of the original range, the signal is triggered only if subsequent closes weaken again”—is very much in line with the technical analysis principle of “role reversal” (a support level becomes resistance after being broken).
The volume indicator at the bottom shows extremely large red volume bars during the earlier plunge (panic selling / major players offloading). During the recent rebound, however, volume has contracted noticeably (a low-volume bounce), indicating weak buying interest. The current rise is merely a recovery after being oversold, not a reversal.
Here is the trading plan:
Entry zone: 76344 (near the current price, at rebound resistance).
Stop-loss: 78570 (placed above the lower boundary of the original range and the recent rebound high; the risk-management rationale is sound and the risk is controllable).
Take-profit targets: Take profits in three stages at 75000, 73785, and 72515. This is a prudent strategy for securing gains in stages.
Break-even rule: After reaching the first take-profit level of 75000, it is recommended to move the stop-loss down to the entry price (break-even). This is an excellent capital-management habit.