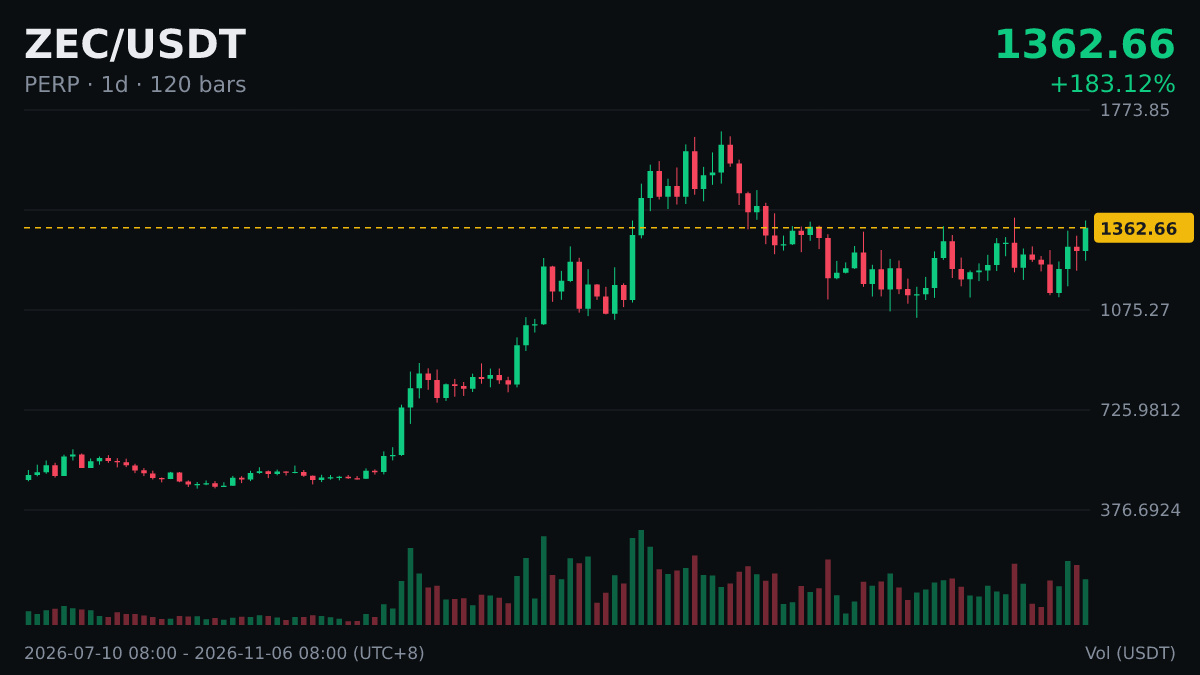
$ZEC The daily chart is above MA50 (1316.96).
Folks, how do you read moving averages? Here’s the short version.
To tell whether the price has moved above or fallen below a moving average, many people use the daily closing price. It’s common for the price to cross it intraday and then return to its original side.
The relationship between short- and long-term moving averages is also often used to gauge the trend: when the short-term average is above the long-term one, it suggests a bullish bias; when it’s below, a bearish bias. But both describe past price movements.
With leveraged trading, first consider whether you can withstand the worst-case scenario, then think about what the indicators are saying.
#ZEC
Folks, how do you read moving averages? Here’s the short version.
To tell whether the price has moved above or fallen below a moving average, many people use the daily closing price. It’s common for the price to cross it intraday and then return to its original side.
The relationship between short- and long-term moving averages is also often used to gauge the trend: when the short-term average is above the long-term one, it suggests a bullish bias; when it’s below, a bearish bias. But both describe past price movements.
With leveraged trading, first consider whether you can withstand the worst-case scenario, then think about what the indicators are saying.
#ZEC