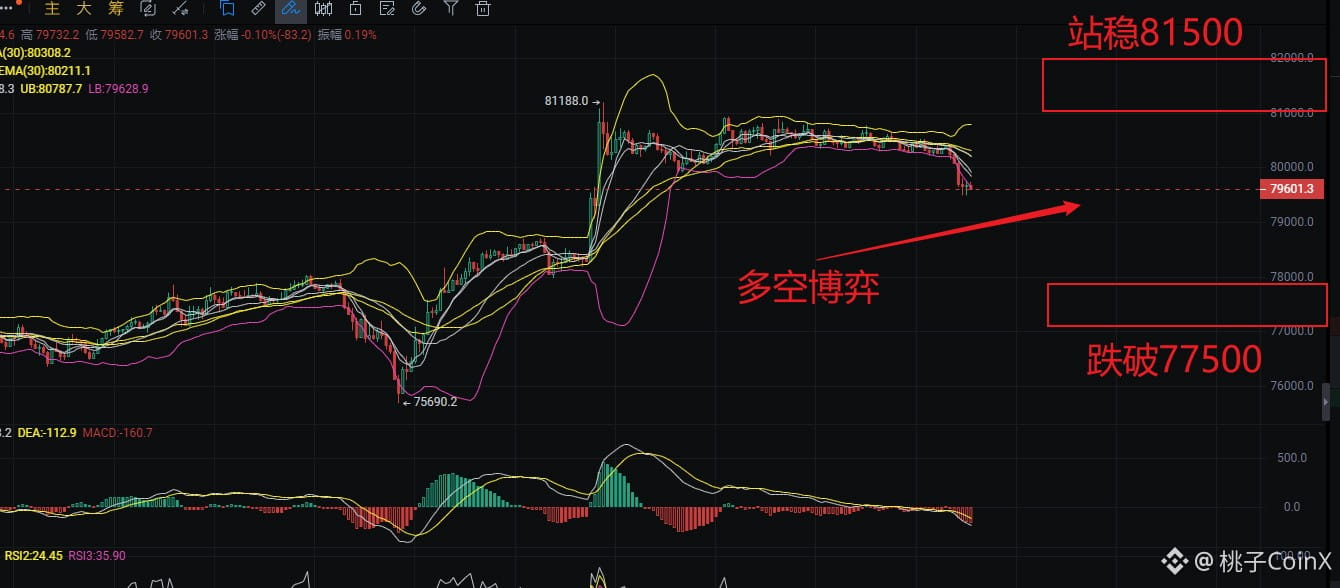
$BTC Will it ultimately go up or down? We just need to see which of these two moving averages holds
BTC has been fluctuating around $80,000 for nearly a month. It can neither break higher nor fall lower, and the main reason is that buyers and sellers are caught between two key cost levels.
Around $81,500 above is the average cost basis of ETF funds. Many investors are currently underwater, and every time the price rebounds to this level, some choose to exit at breakeven, creating selling pressure.
$77,500–$78,000 below is the market’s overall average cost basis. When the price falls to this level, some early holders and dip buyers step in to absorb the selling, providing support.
The two key levels to watch next are:
• A break above $81,500, followed by a strong hold on high volume and a successful retest, would indicate that overhead supply is being absorbed, potentially opening the door to further gains.
• A break below $77,500 that is not quickly reclaimed would indicate weakening support, and the market could weaken further.
Simply put: $81,500 is resistance above, while $77,500–$78,000 is support below. A breakout above is bullish; a breakdown below is bearish. Until the range is broken, the market will likely continue seesawing between buyers and sellers.
Prices don’t hold grudges, but cost basis keeps score!
#币安安全事件恢复进展:98%被盗资产已回填 #StrategySTRC时隔超170天恢复发行
BTC has been fluctuating around $80,000 for nearly a month. It can neither break higher nor fall lower, and the main reason is that buyers and sellers are caught between two key cost levels.
Around $81,500 above is the average cost basis of ETF funds. Many investors are currently underwater, and every time the price rebounds to this level, some choose to exit at breakeven, creating selling pressure.
$77,500–$78,000 below is the market’s overall average cost basis. When the price falls to this level, some early holders and dip buyers step in to absorb the selling, providing support.
The two key levels to watch next are:
• A break above $81,500, followed by a strong hold on high volume and a successful retest, would indicate that overhead supply is being absorbed, potentially opening the door to further gains.
• A break below $77,500 that is not quickly reclaimed would indicate weakening support, and the market could weaken further.
Simply put: $81,500 is resistance above, while $77,500–$78,000 is support below. A breakout above is bullish; a breakdown below is bearish. Until the range is broken, the market will likely continue seesawing between buyers and sellers.
Prices don’t hold grudges, but cost basis keeps score!
#币安安全事件恢复进展:98%被盗资产已回填 #StrategySTRC时隔超170天恢复发行