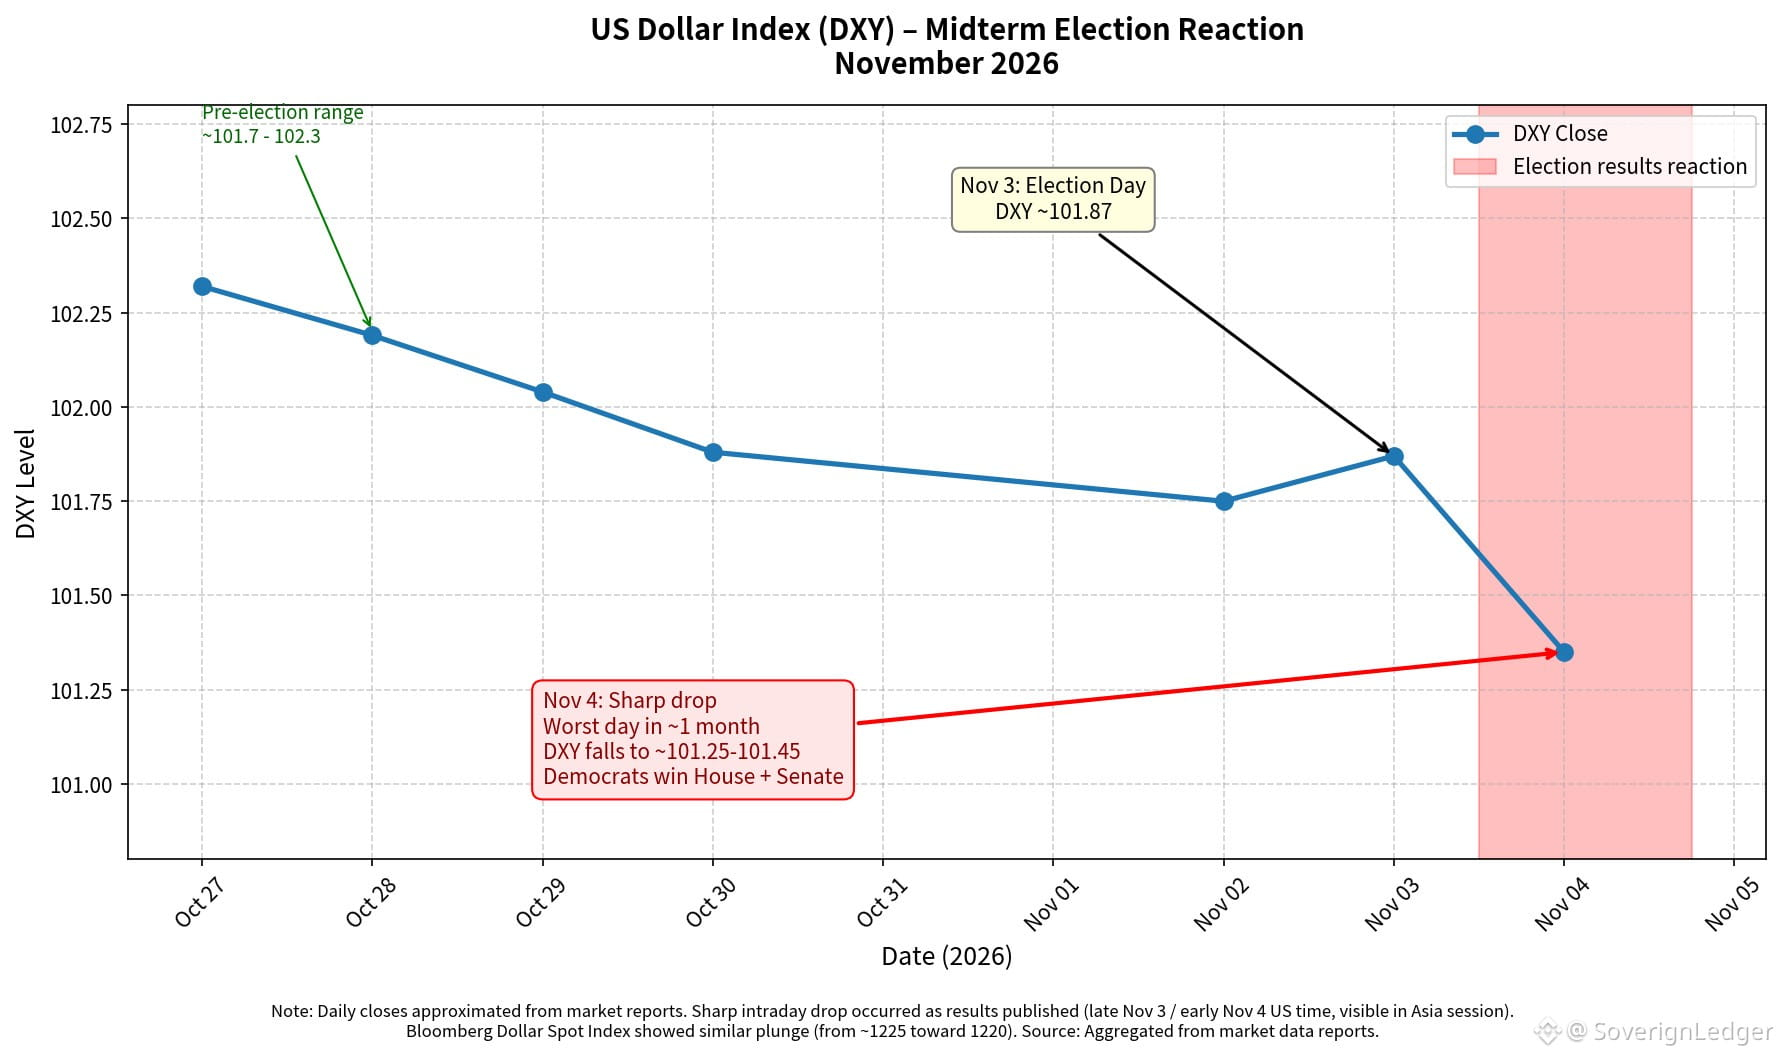
📊Chart of the US Dollar Index (DXY) around the 2026 midterm elections:
🔖Marks and timeline on the chart:
- Late October – early November (pre-election): DXY traded in a relatively firm range roughly between 101.7 – 102.3.
- November 3, 2026 (Election Day): DXY closed near 101.87. Voting took place across the US.
- Late November 3 – early November 4 (results published): As results showed Democrats winning control of "both the House and the Senate", the dollar came under heavy selling pressure. This is the red-highlighted zone.
- November 4, 2026: Sharp drop — DXY fell to the "101.25–101.45" area (low near 101.10–101.25 in some sessions). This was its "worst day in about a month".
👉 Additional notes for clarity:
- The drop reflected market expectations of political gridlock, potential limits on fiscal spending, and possible tighter AI regulation — all of which reduced support for the dollar and US yields.
The chart uses approximate daily closes based on available market reports, with clear arrows and labels marking the election-day level and the subsequent sell-off. All major points are highlighted for easy reading.
$USDC $BTC $MSFTB
🔖Marks and timeline on the chart:
- Late October – early November (pre-election): DXY traded in a relatively firm range roughly between 101.7 – 102.3.
- November 3, 2026 (Election Day): DXY closed near 101.87. Voting took place across the US.
- Late November 3 – early November 4 (results published): As results showed Democrats winning control of "both the House and the Senate", the dollar came under heavy selling pressure. This is the red-highlighted zone.
- November 4, 2026: Sharp drop — DXY fell to the "101.25–101.45" area (low near 101.10–101.25 in some sessions). This was its "worst day in about a month".
👉 Additional notes for clarity:
- The drop reflected market expectations of political gridlock, potential limits on fiscal spending, and possible tighter AI regulation — all of which reduced support for the dollar and US yields.
The chart uses approximate daily closes based on available market reports, with clear arrows and labels marking the election-day level and the subsequent sell-off. All major points are highlighted for easy reading.
$USDC $BTC $MSFTB