### AINUSDT – 1H Technical Analysis
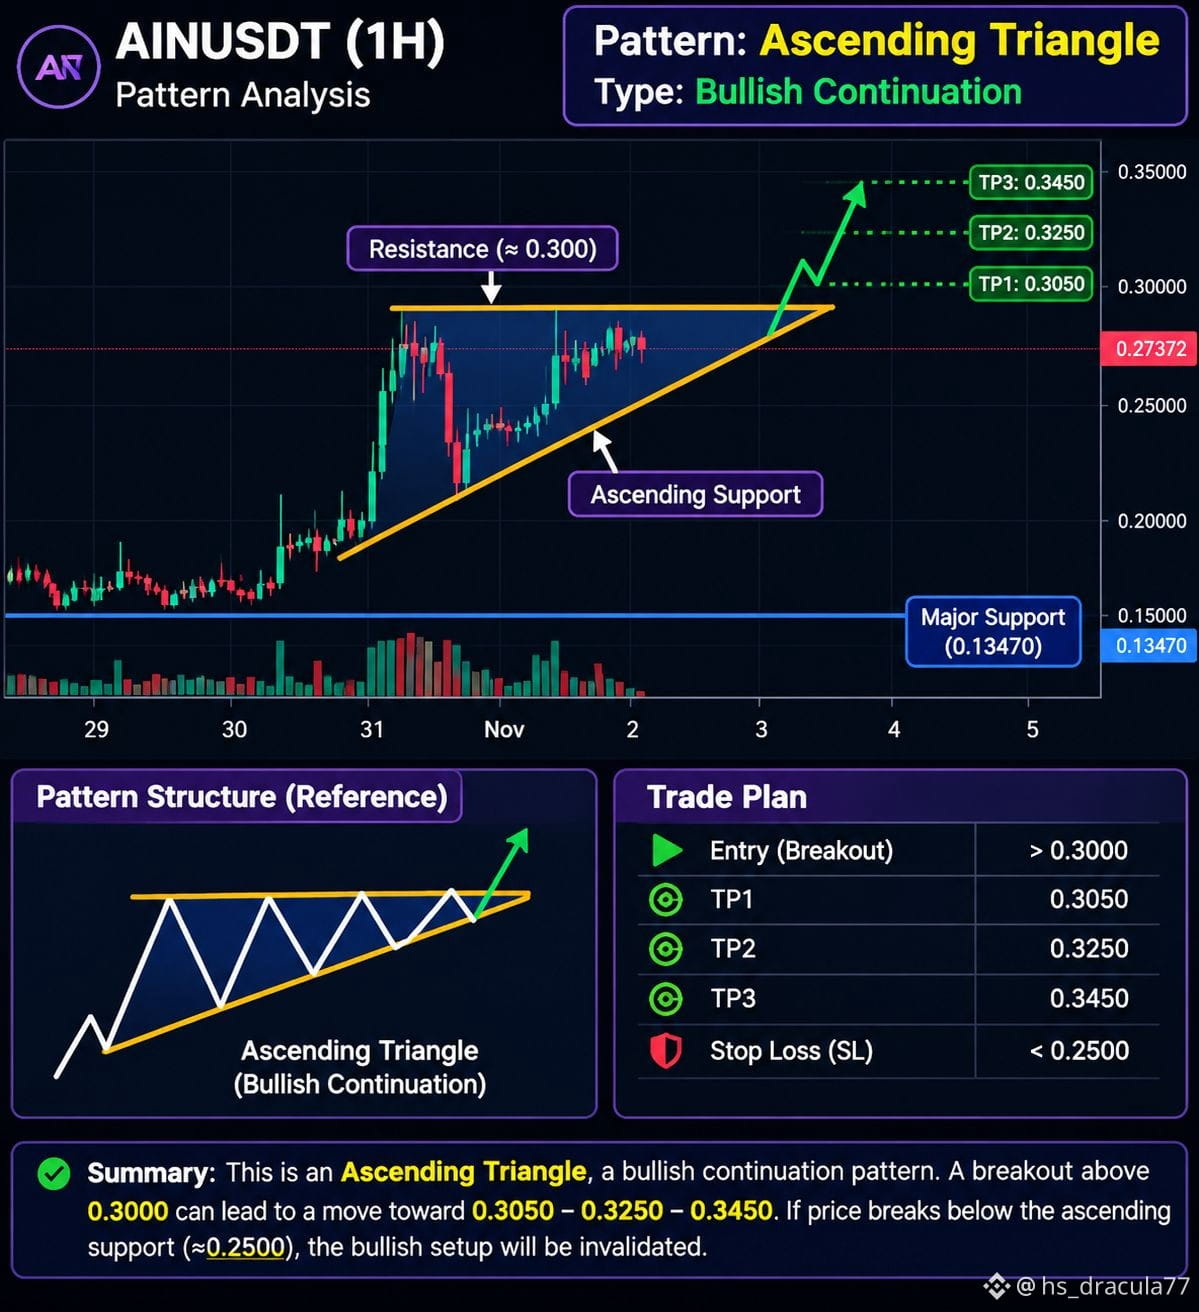
Pattern: Ascending Triangle | Bullish Continuation Structure
Current Price: $0.27372 Resistance Zone: $0.2900–$0.3000 Ascending Support: $0.2300–$0.2500 Major Support: $0.13470
### 1\. Market Structure
$AIN is forming an Ascending Triangle pattern on the 1-hour timeframe, which is generally considered a bullish continuation structure.
After a strong upward move, the price entered a consolidation phase. Buyers are gradually pushing the price higher, creating higher lows, while sellers continue defending the horizontal resistance around $0.2900–$0.3000.
This structure indicates that buying pressure may be building beneath resistance.
### 2\. Key Technical Levels
| Level | Price |
| -------------------- | -------- |
| Major Resistance | $0.3000 |
| Immediate Resistance | $0.2900 |
| Current Price | $0.27372 |
| First Support | $0.2500 |
| Second Support | $0.2300 |
| Major Support | $0.13470 |
### 3\. Bullish Scenario
If buyers successfully break above the $0.2900–$0.3000 resistance zone, we could see a bullish continuation.
Potential upside targets:
* TP1: $0.3050
* TP2: $0.3250
* TP3: $0.3450
A strong 1H candle close above $0.3000, followed by a successful retest, would provide stronger breakout confirmation.
Increasing volume during the breakout would further strengthen the bullish setup.
### 4\. Bearish Scenario
If the price fails to break resistance and loses the ascending trendline, bearish pressure could increase.
Important downside levels to monitor:
* $0.2500
* $0.2300
* $0.2000
$AIN breakdown below the rising support with strong selling volume could invalidate the bullish continuation structure.
### 5\. Volume & Order Book Analysis
The screenshot shows approximately:
* Buyers: 66.90%
* Sellers: 33.10%
$AIN currently shows a bullish consolidation structure through an Ascending Triangle pattern. Buyers are creating higher lows, while sellers are defending the $0.2900–$0.3000 resistance zone.
Pattern: Ascending Triangle | Bullish Continuation Structure
Current Price: $0.27372 Resistance Zone: $0.2900–$0.3000 Ascending Support: $0.2300–$0.2500 Major Support: $0.13470
### 1\. Market Structure
$AIN is forming an Ascending Triangle pattern on the 1-hour timeframe, which is generally considered a bullish continuation structure.
After a strong upward move, the price entered a consolidation phase. Buyers are gradually pushing the price higher, creating higher lows, while sellers continue defending the horizontal resistance around $0.2900–$0.3000.
This structure indicates that buying pressure may be building beneath resistance.
### 2\. Key Technical Levels
| Level | Price |
| -------------------- | -------- |
| Major Resistance | $0.3000 |
| Immediate Resistance | $0.2900 |
| Current Price | $0.27372 |
| First Support | $0.2500 |
| Second Support | $0.2300 |
| Major Support | $0.13470 |
### 3\. Bullish Scenario
If buyers successfully break above the $0.2900–$0.3000 resistance zone, we could see a bullish continuation.
Potential upside targets:
* TP1: $0.3050
* TP2: $0.3250
* TP3: $0.3450
A strong 1H candle close above $0.3000, followed by a successful retest, would provide stronger breakout confirmation.
Increasing volume during the breakout would further strengthen the bullish setup.
### 4\. Bearish Scenario
If the price fails to break resistance and loses the ascending trendline, bearish pressure could increase.
Important downside levels to monitor:
* $0.2500
* $0.2300
* $0.2000
$AIN breakdown below the rising support with strong selling volume could invalidate the bullish continuation structure.
### 5\. Volume & Order Book Analysis
The screenshot shows approximately:
* Buyers: 66.90%
* Sellers: 33.10%
$AIN currently shows a bullish consolidation structure through an Ascending Triangle pattern. Buyers are creating higher lows, while sellers are defending the $0.2900–$0.3000 resistance zone.