Gold Hits Critical Inflection: Will the $3,800 Floor Hold or Collapse?🛑
Key Chart Highlights Visualized
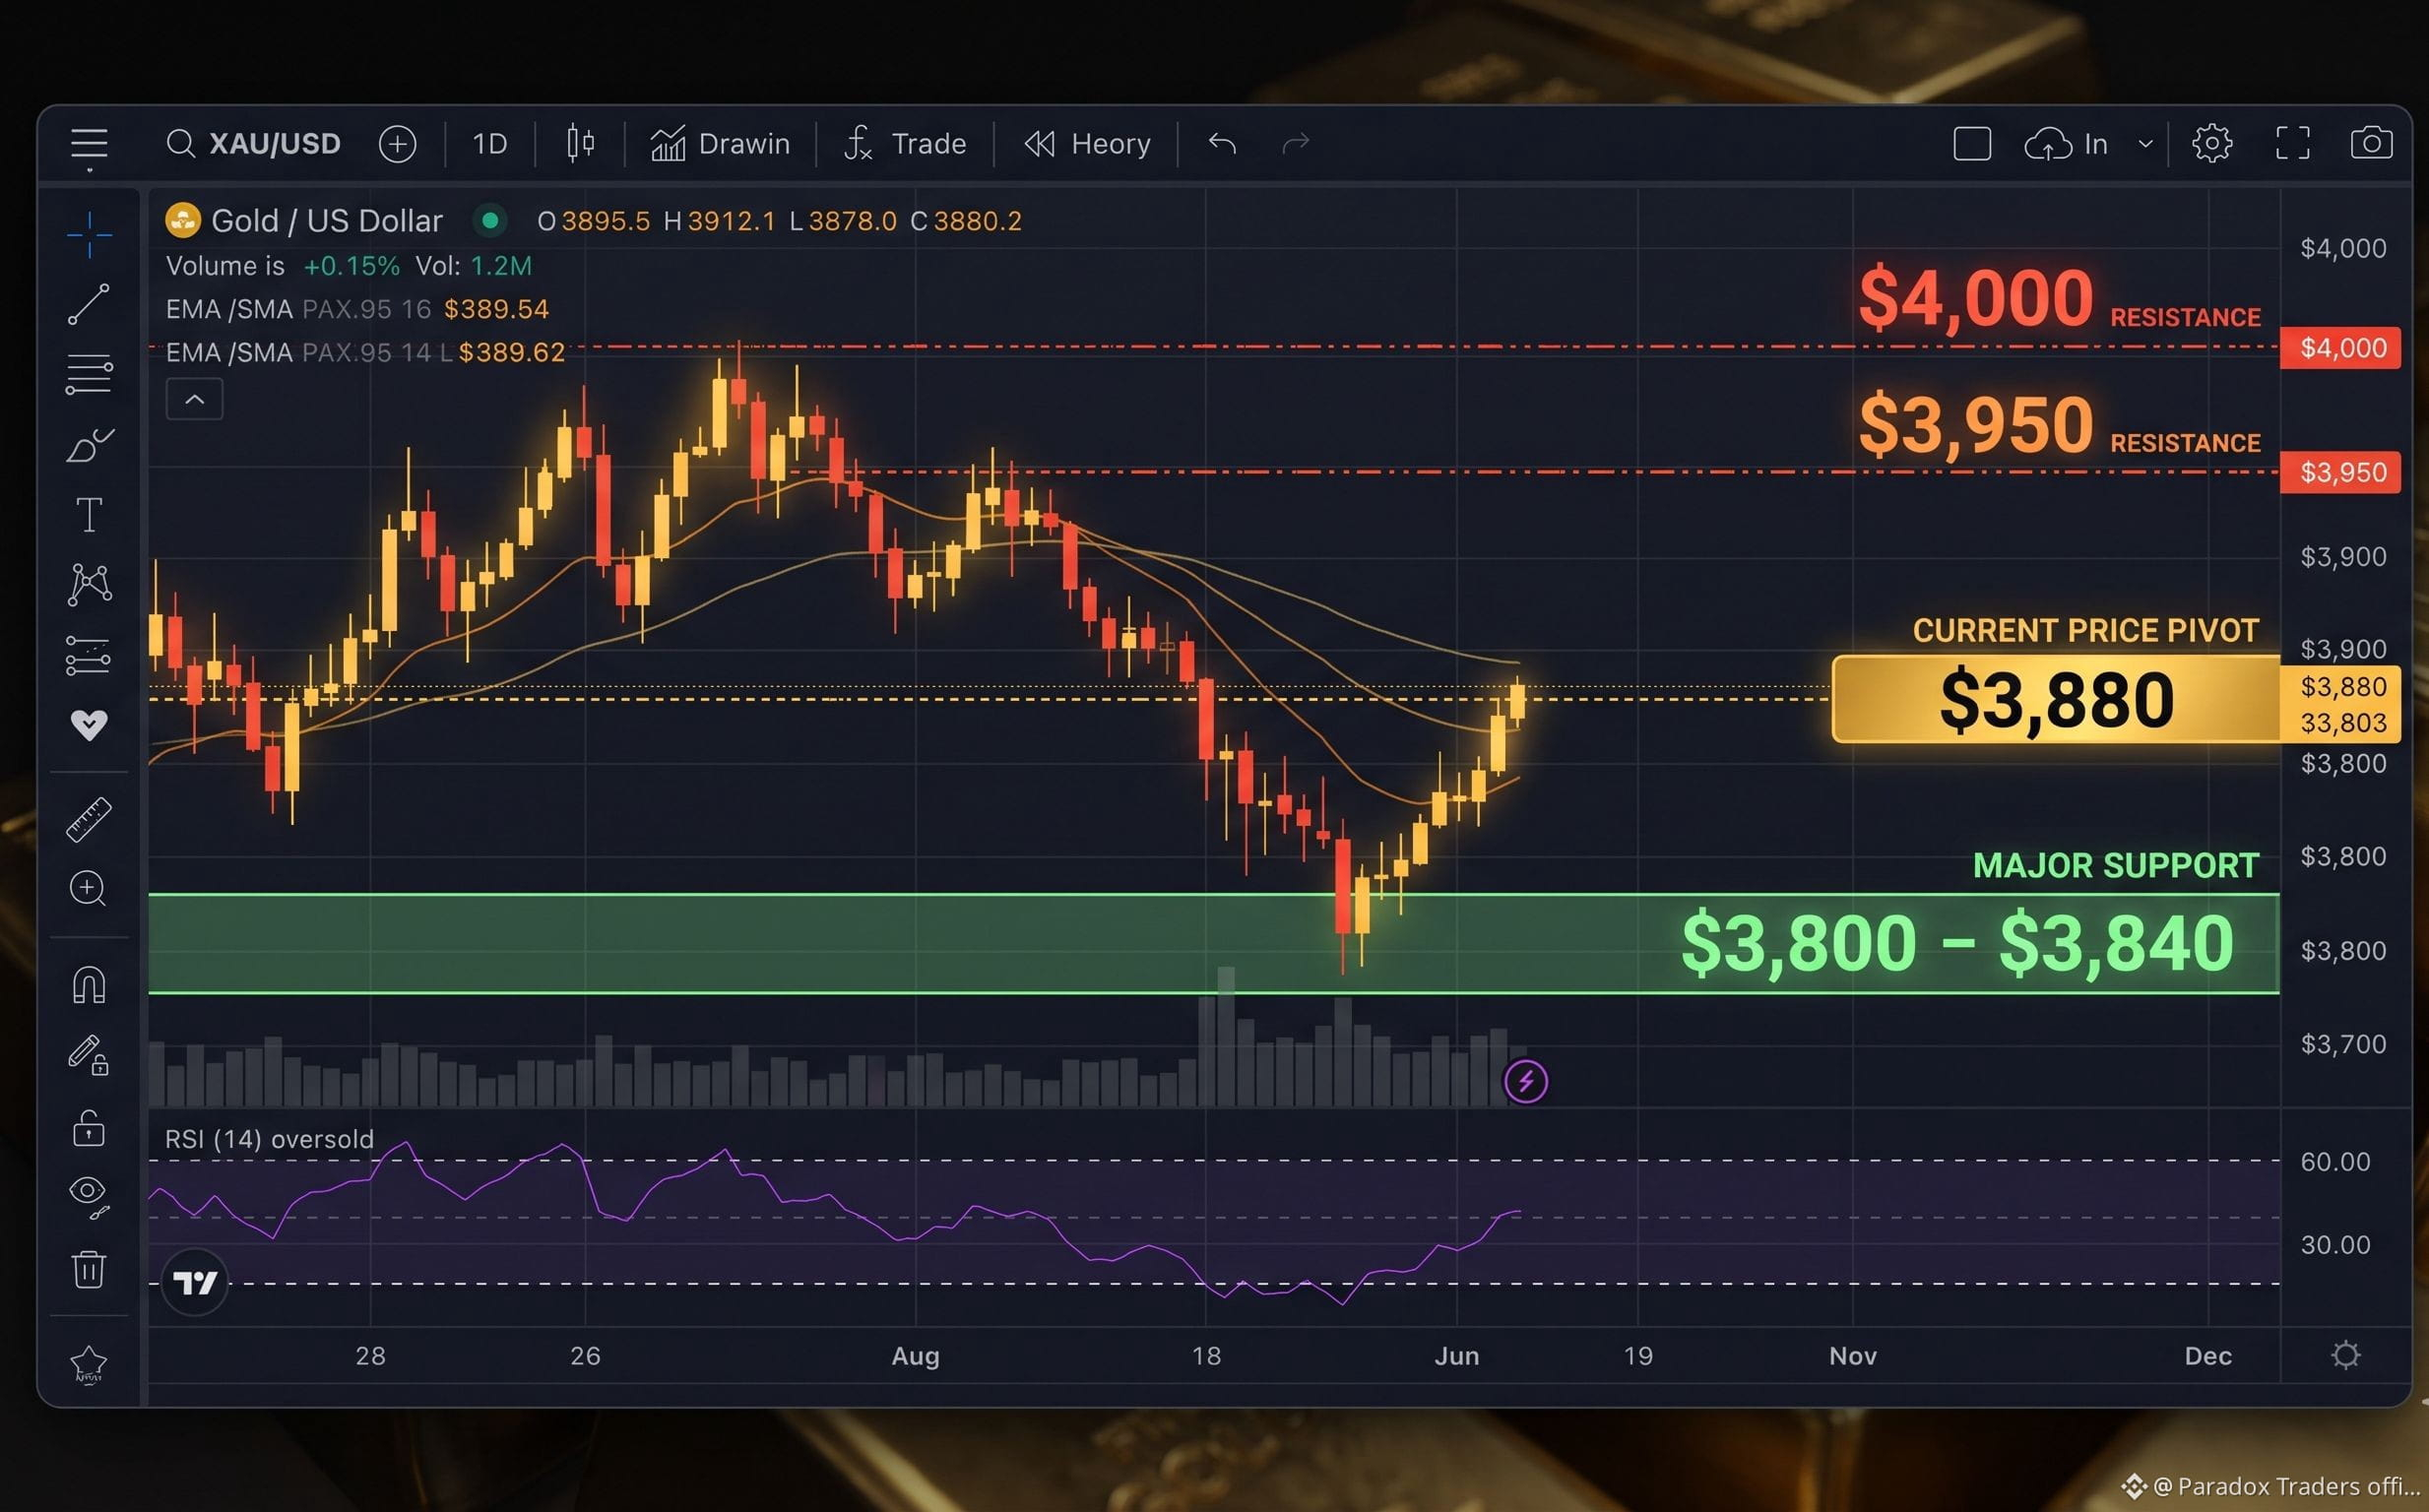
Current Pivot ($3,880): Represents Friday's closing consolidation zone where price is testing short-term trend exhaustion.
Overhead Resistance ($3,950 & $4,000): Highlights the primary target zones for any technical relief rally or mean-reversion move.
Major Support Zone ($3,800–$3,840): Marks the critical multi-year trend and Fibonacci demand floor if the downward momentum extends.
RSI Indicator (Bottom Panel): Shows the oscillator testing oversold territory below the 30 line, signaling potential for a short-covering bounce.
Key Chart Highlights Visualized
Current Pivot ($3,880): Represents Friday's closing consolidation zone where price is testing short-term trend exhaustion.
Overhead Resistance ($3,950 & $4,000): Highlights the primary target zones for any technical relief rally or mean-reversion move.
Major Support Zone ($3,800–$3,840): Marks the critical multi-year trend and Fibonacci demand floor if the downward momentum extends.
RSI Indicator (Bottom Panel): Shows the oscillator testing oversold territory below the 30 line, signaling potential for a short-covering bounce.