【$TRX amid a hot catalyst: How well are price and volume aligned? A dip-buying plan included】
【Hot Event】
I just came across this news and immediately pulled up the TRXUSDT chart to compare.
「TRX Options Launch on Blockchain.com, Expanding Global Access to the TRON Ecosystem」——NewsBTC reported that TRON DAO, the community-governed DAO dedicated to accelerating the decentralization of the internet through bl…
The biggest risk with event-driven market moves is sentiment running too far ahead, so whether key levels hold matters more than the news itself.
【Market Snapshot】
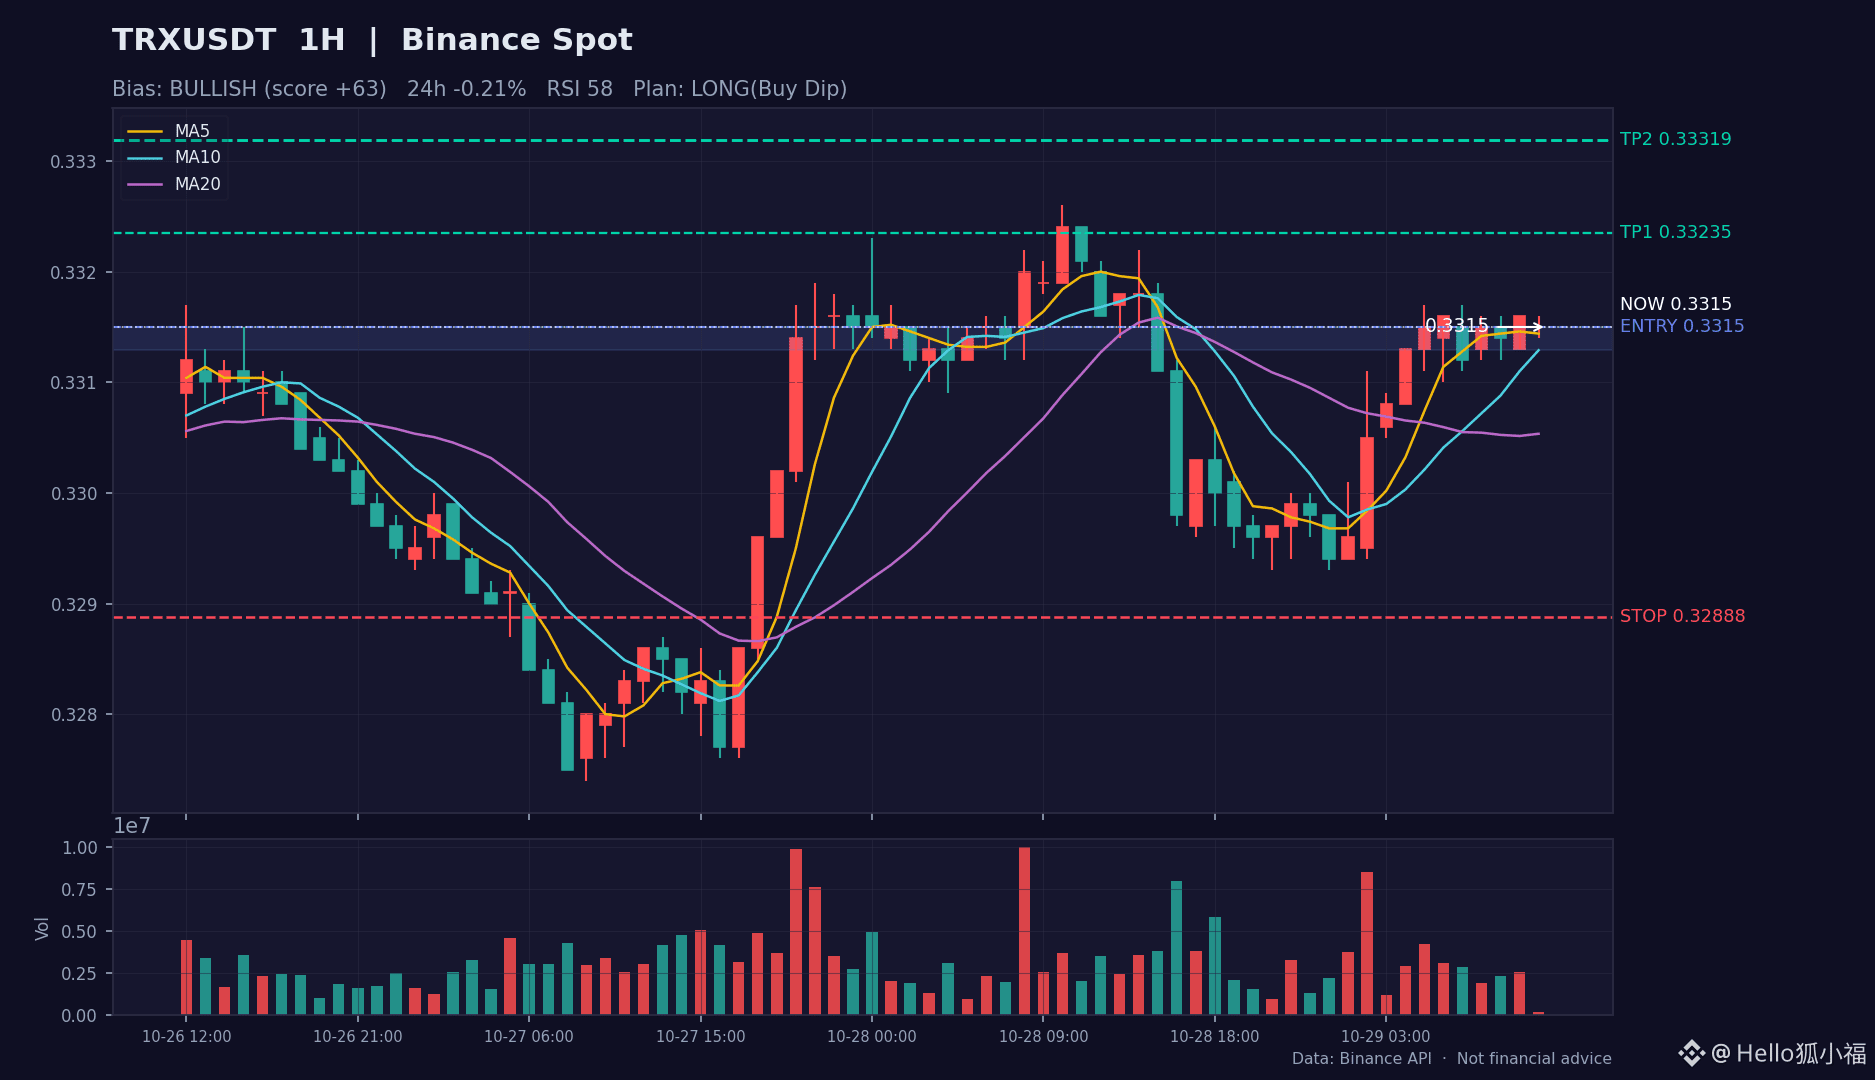
$TRX is currently at 0.33150, down 0.21% over 24 hours, with 24-hour trading volume of approximately 25.8M USDT.
【Technical Breakdown】
· Moving averages: MA5>MA10>MA20>MA60, a textbook bullish alignment; short- and medium-term cost bases are both rising
· Momentum: The MACD fast line is above the zero line, with red bars prevailing; bullish momentum is continuing. RSI (58) is strong but not overbought, and bullish momentum remains intact
· Pattern: Price is hovering near the Bollinger middle band, whose hold or breach will determine the short-term pace; volume is contracting (0.1x average volume), so directional signals should be treated with caution in this low-volume environment
【Directional View】
Overall score: 63/100. The structure leans bullish: moving averages and momentum indicators are aligned to the upside. Until price pulls back and breaks below the lower boundary of the entry zone, the preference is to scale in on dips. A breakout above the previous high could put the second target in sight; a high-volume break below the stop-loss level invalidates this view.
【参考交易计划】
· Strategy: Buy dips
· Entry zone: 0.33129 ~ 0.33150
· Take profit: First target 0.33235, second target 0.33319
· Stop loss: 0.32888
· Position size: Light, 5%-10%; strictly exit if the stop-loss level is breached
· Chart: The candlestick analysis chart is attached to the post (1-hour chart, red for rising and green for falling; the entry zone/take-profit/stop-loss levels are marked with colored lines)
【Risk Warning】Leveraged contracts can cause double the damage if you get the direction wrong. Once you’ve set your stop loss in the plan, don’t move it by hand.
This is only my personal review and technical analysis, and does not constitute any investment advice. DYOR.
$TRX #TRX #加密货币 #Market Analysis