$PAXG stock latest analyse
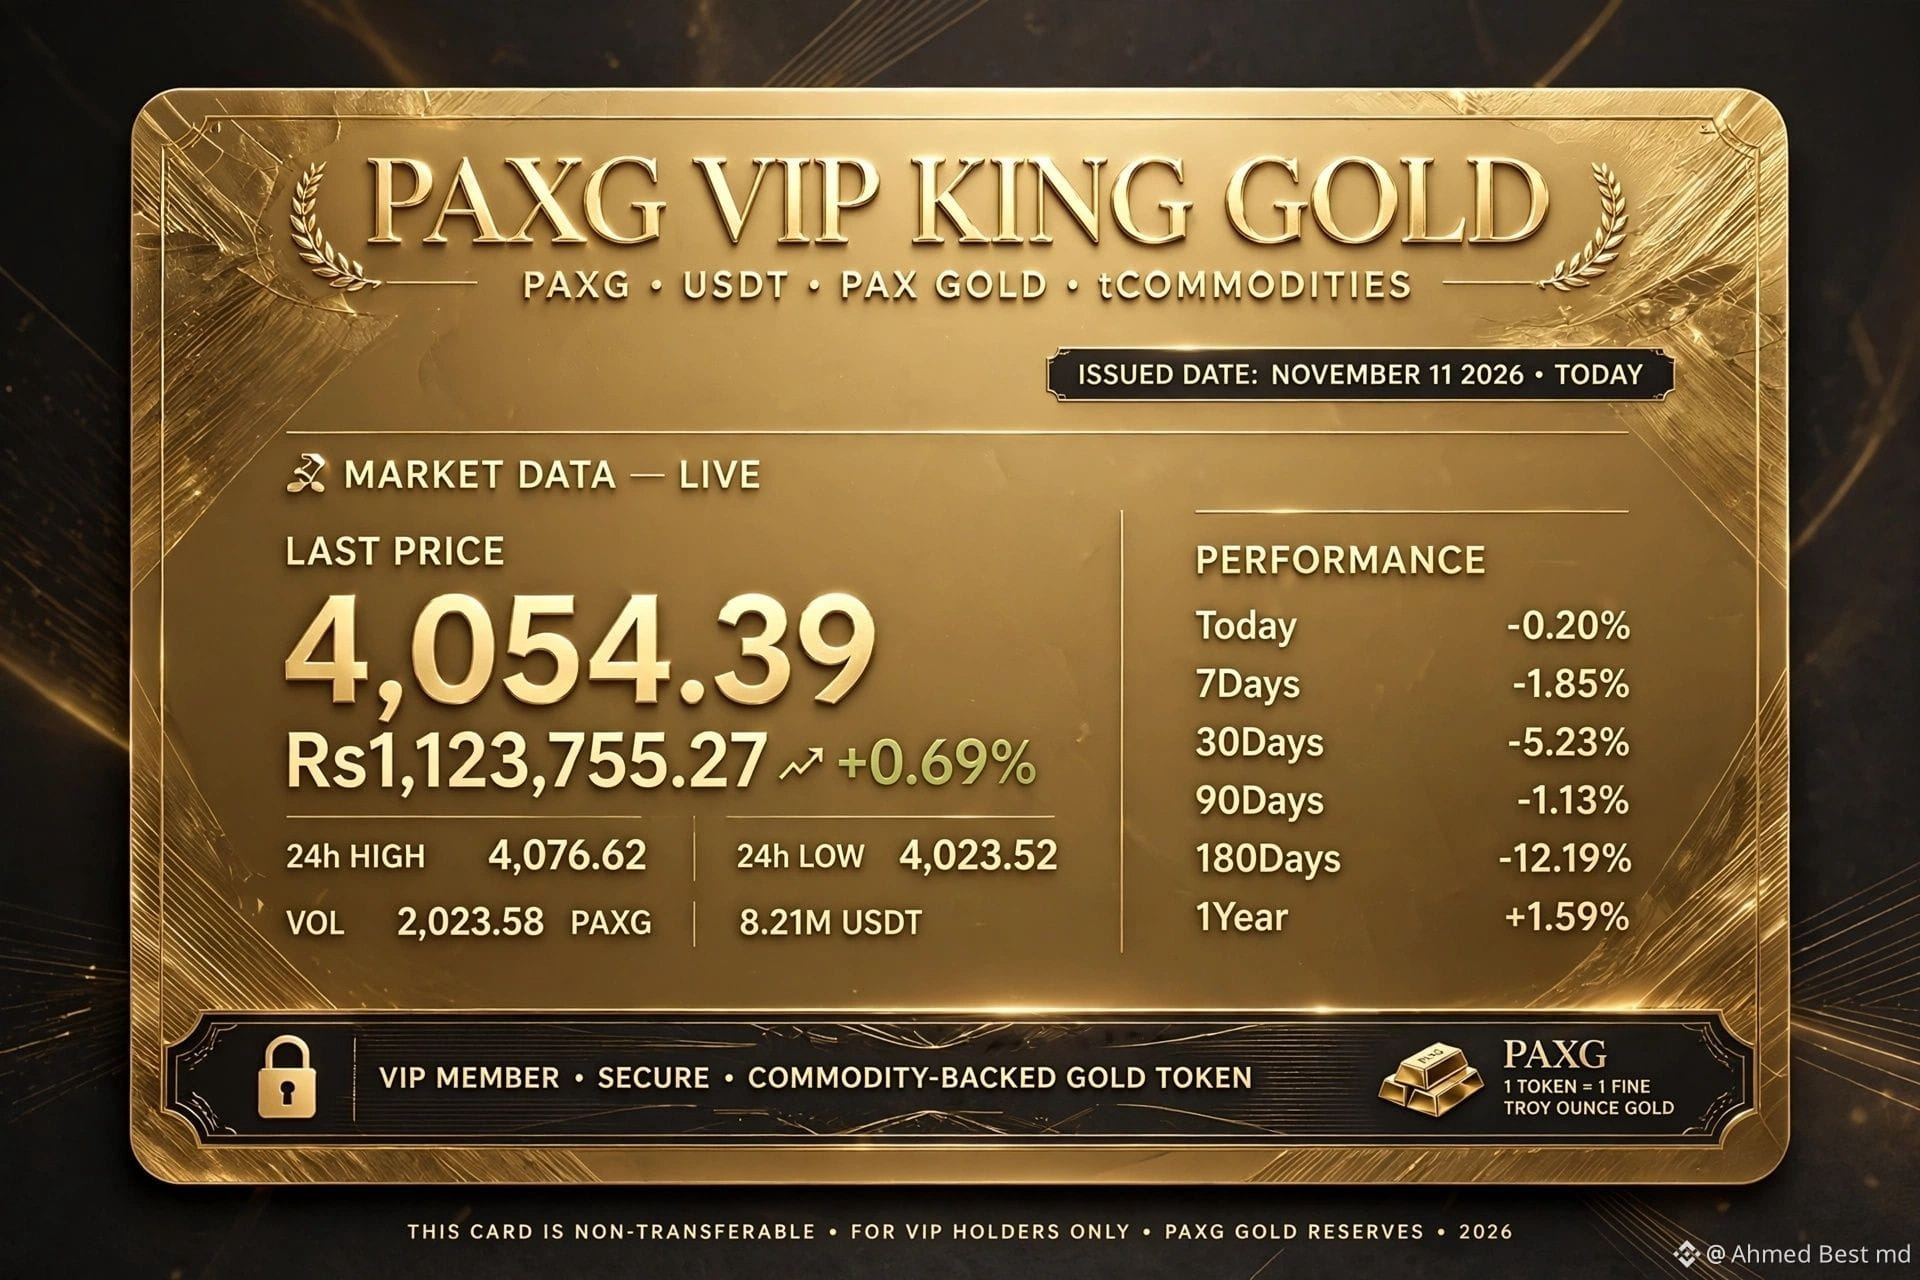
*4,054.39 +0.69% Rs1,123,755.27*
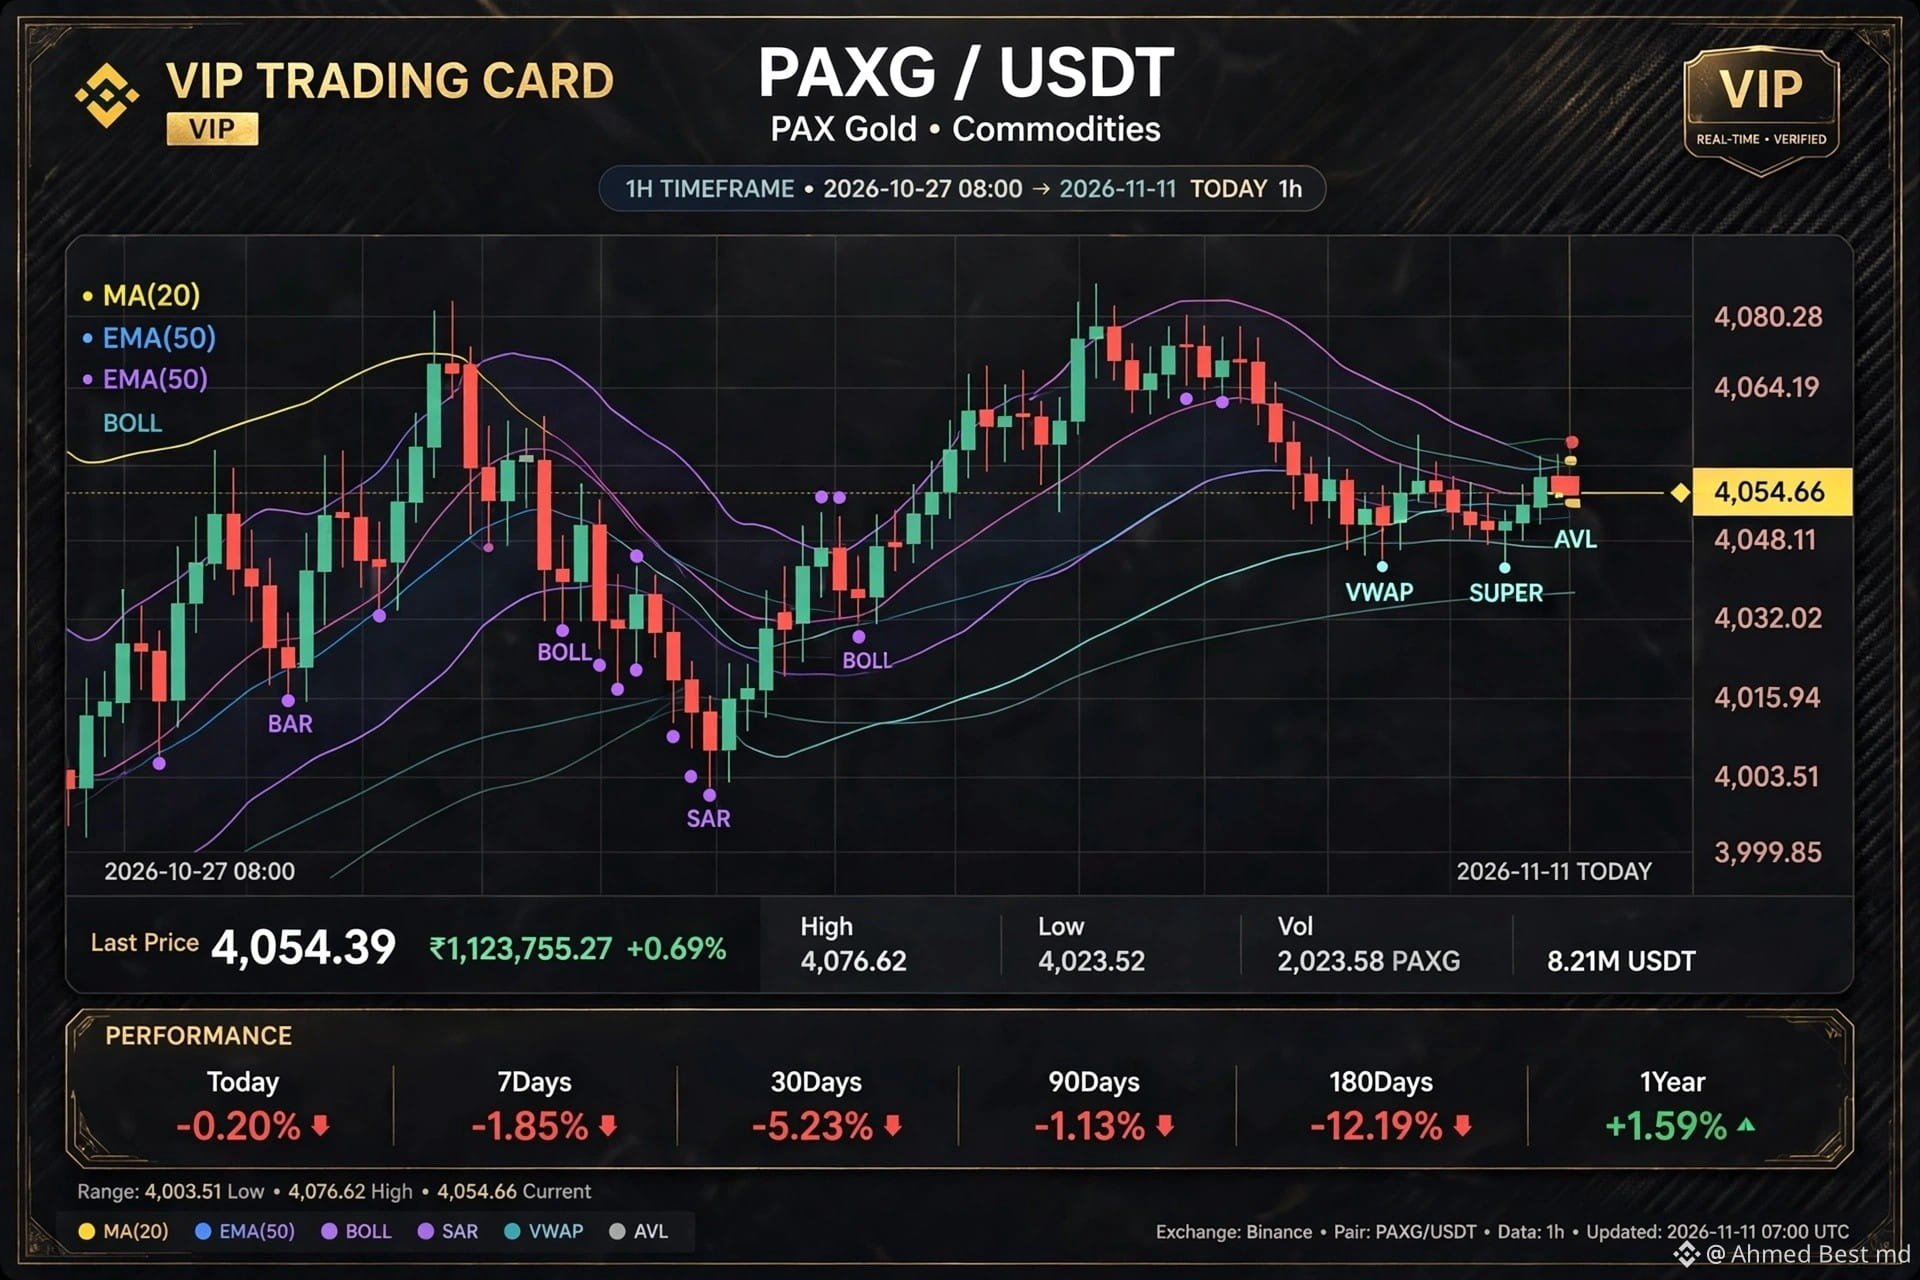
24h High 4,076.62 / Low 4,023.52 / Vol 2,023.58 PAXG / 8.21M USDT
*1h Chart:* 4,003.51 Low Oct 27 → 4,076.62 High = *+1.82% GOLD RUSH*, now 4,054.66 -0.54% pullback from high. Strong breakout from 4,015 to 4,076.
Levels: 4,080.28 extension / 4,076.62 High / 4,064.19 / 4,054.66 current / 4,048.11 / 4,032.02 / 4,015.94 / 4,003.51 bottom buy zone / 3,999.85 deep
*Performance:* Today -0.20% / 7D -1.85% / 30D -5.23% / 90D -1.13% / 180D -12.19% / 1Y *+1.59%* - Yearly green vs all red short-term = yearly holder still profit
*Indicators:* MA(20) / EMA(50) / BOLL / SAR at 4,003.51 bottom / VWAP / SUPER / AVL - Price 4,054.66 near MA, need reclaim 4,064.19 to confirm uptrend
*Strategy:* PAX Gold tCommodities. Buy dip at 4,032-4,048 VWAP/SUPER support, target 4,064.19 then 4,076.62 retest. Stop below 4,015.94. 4,003.51 wick was massive reversal buy zone. 1Y +1.59% only Gold token yearly green.
#CanGoogleDefindItsCore #CanMicrosoftDeliverOnAI #EarningsSeason #KOSPISurges6.63%BackAbove6000 #FOMCWatch
-🤫