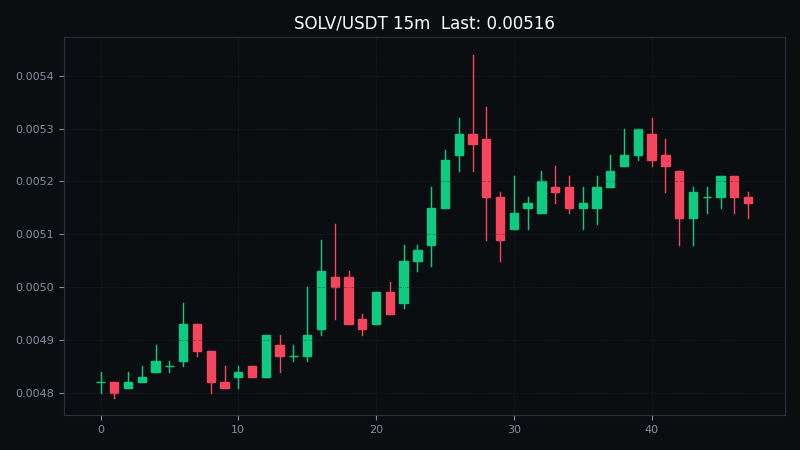
Comparing $SOLV with its history: up 12.7% in 24h, currently at 0.00516.
Before every major rally, the market sends signals: either a high-volume breakout after a long period of sideways trading, or an oversold bounce after a deep drop. Looking back at $SOLV ’s historical candlestick chart, which scenario does this look more like? History doesn’t repeat, but it often rhymes.
Do you use historical candlestick charts to find entry and exit points? #SOLV
For discussion purposes only; this is not investment advice.