
Let’s take a look at the current situation for SNDKB (SanDisk bStocks), which is in a sustained downtrend, showing a local daily decline of -3.04% and trading at 1 296,80 USDT.
Key takeaways and technical analysis from the chart:
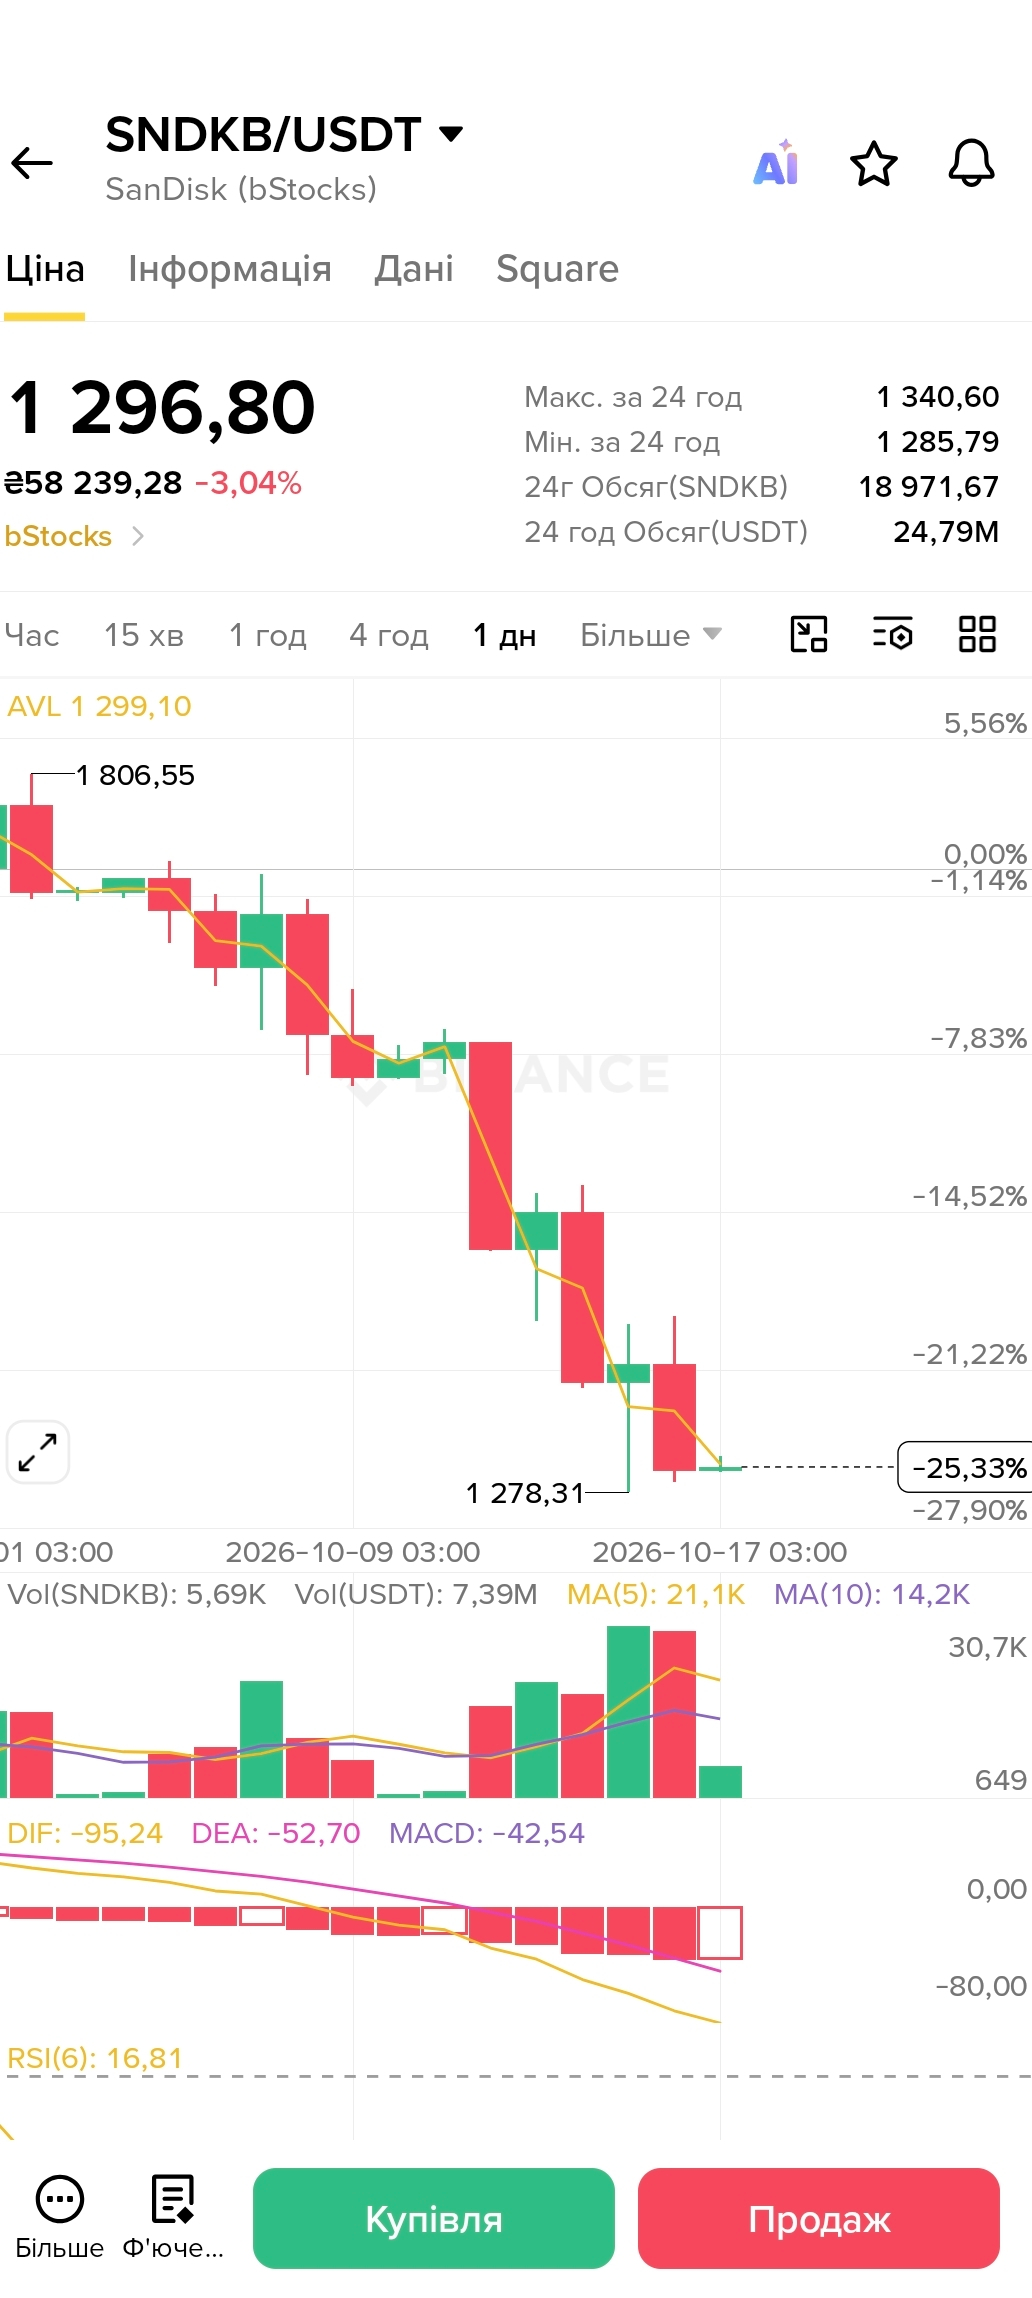
Price metrics: The 24-hour high was recorded at 1 340,60 USDT, while the low reached 1 285,79 USDT. The asset continues to trade well below its previous local peaks (1 806,55 USDT) and is testing support levels near the local low of 1 278,31 USDT.
Trading volume: Daily turnover stands at 24.79 million USDT (with a volume of 18,971.67 SNDKB), indicating that liquidity remains high during the correction.
Technical indicators:
MACD: The histogram and lines are deep in negative territory (DIF: -95.24, DEA: -52.70, MACD: -42.54), confirming that the bears are in control.
RSI(6): Has fallen to an extremely low value of 16.81, signaling that the asset is critically oversold on the daily timeframe.
⚠️ An RSI reading in deeply oversold territory often precedes a technical rebound, but entering against a strong trend without additional confirmation is very risky. We’re waiting for reversal patterns to form, sticking to risk management, and always setting stop-losses!
💬 What do you think about SNDKB? Are you expecting a rebound from current levels, or will the sell-off continue? Share your thoughts in the comments! 👇
#BinanceSquare #SNDKB #Sandisk #BStocks #cryptotrading #TechnicalAnalysis