Day 15/100 — Learning on-chain analysis from zero. 🙌
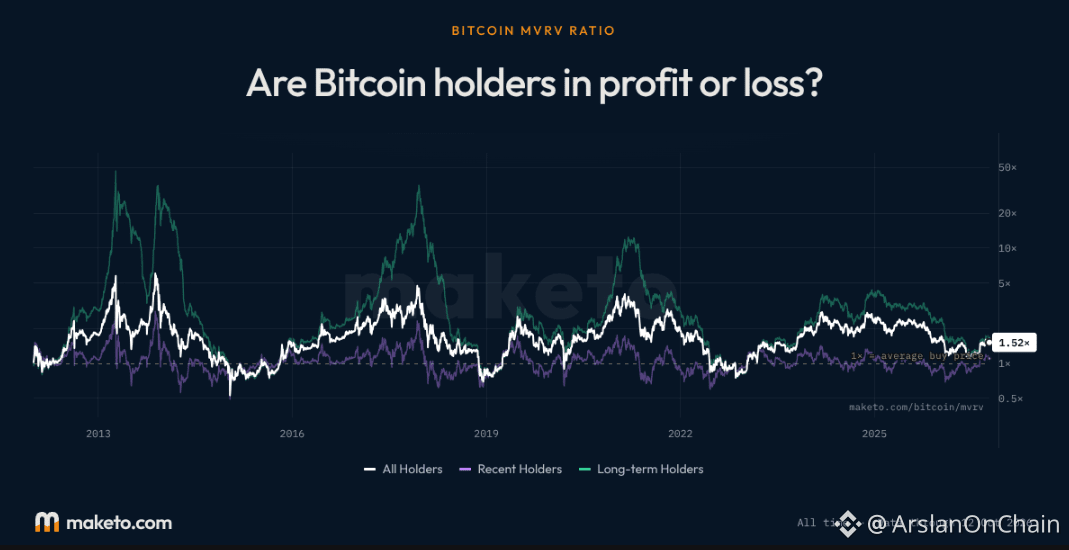
Today: How far is $BTC above its average cost basis?
Yesterday, we learned about the lines.
Today, we measure the distance between price and the average.
The idea is simple:
Current BTC price ÷ estimated average cost basis = ratio
- 1x: Price is at the estimated average.
- Above 1x: Price is above that average.
- Below 1x: Price is below it.
The further the ratio rises, the larger the market’s estimated profit cushion becomes. But it doesn’t mean every holder is profitable—or that a correction is guaranteed.
A recent reading, 12–13 Oct 2026:
BTC around $84K
Estimated average cost: around $54K
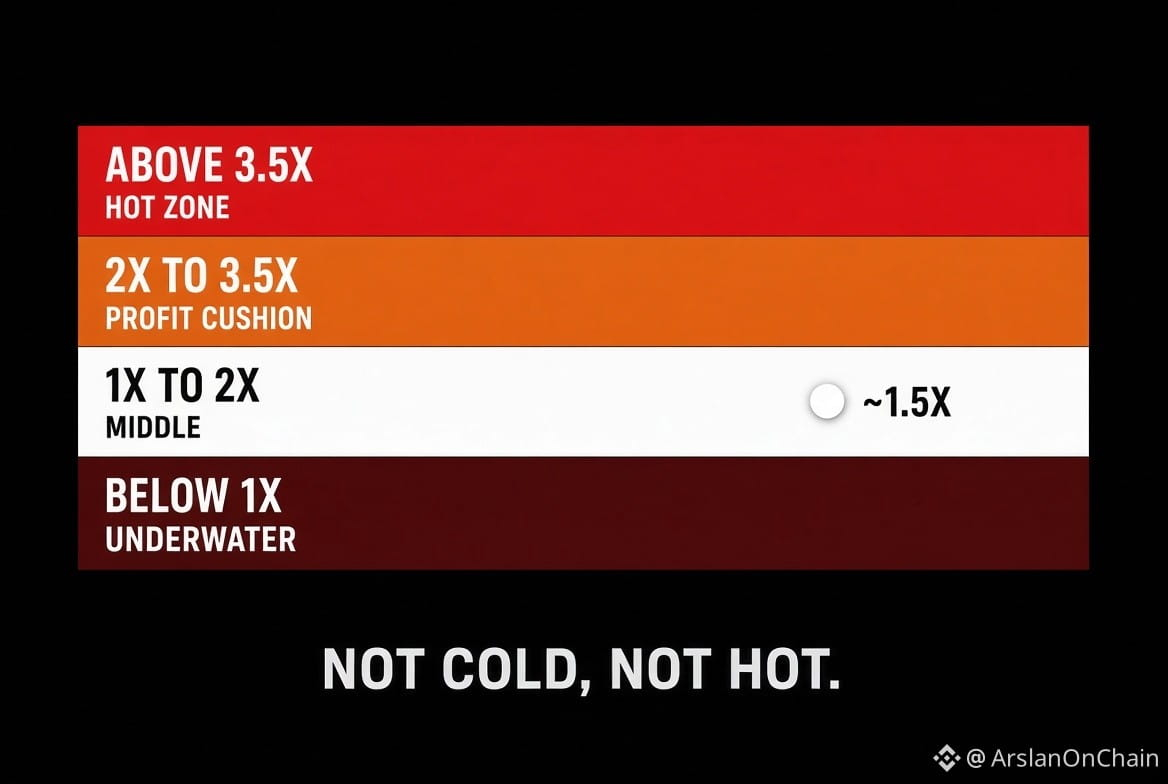
Ratio: roughly 1.55x
That puts BTC about 55% above the estimated average cost basis.
Not every holder bought at $54K. This is a market-wide estimate, not everyone’s personal entry.
Your turn 👀
Open Arkham and find an old wallet.
Compare the price when its BTC arrived with today’s price. Calculate how many times higher or lower the price is now.
Screenshot your example and share the ratio in the comments.
Tomorrow: the heat zones—and what this metric can tell us about market conditions.
85 days left. New here? Start today. You can catch up.
$BLUAI $TRUTH
Today: How far is $BTC above its average cost basis?
Yesterday, we learned about the lines.
Today, we measure the distance between price and the average.
The idea is simple:
Current BTC price ÷ estimated average cost basis = ratio
- 1x: Price is at the estimated average.
- Above 1x: Price is above that average.
- Below 1x: Price is below it.
The further the ratio rises, the larger the market’s estimated profit cushion becomes. But it doesn’t mean every holder is profitable—or that a correction is guaranteed.
A recent reading, 12–13 Oct 2026:
BTC around $84K
Estimated average cost: around $54K
Ratio: roughly 1.55x
That puts BTC about 55% above the estimated average cost basis.
Not every holder bought at $54K. This is a market-wide estimate, not everyone’s personal entry.
Your turn 👀
Open Arkham and find an old wallet.
Compare the price when its BTC arrived with today’s price. Calculate how many times higher or lower the price is now.
Screenshot your example and share the ratio in the comments.
Tomorrow: the heat zones—and what this metric can tell us about market conditions.
85 days left. New here? Start today. You can catch up.
$BLUAI $TRUTH