【GTC: Pullback after a spike, with open interest also contracting】
Short-term view: Wait and see; don’t chase a rebound after a sharp surge. In the full 23:01 BJT rankings, $GTC ranked first by gain, up 71.662% over the rolling 24 hours. A rescan at 23:10 before publication still ranked it first, with the reading at +77.377%, a quote of 0.211930, and quoted trading volume of approximately $549.9 million. Rolling-window figures change quickly and are not fixed readings. Compared with the earlier post at 16:16, the key additions this time are not another mention of the “sharp rise,” but the hourly closes after the spike and pullback, same-time trading-volume comparisons, and changes in open interest.
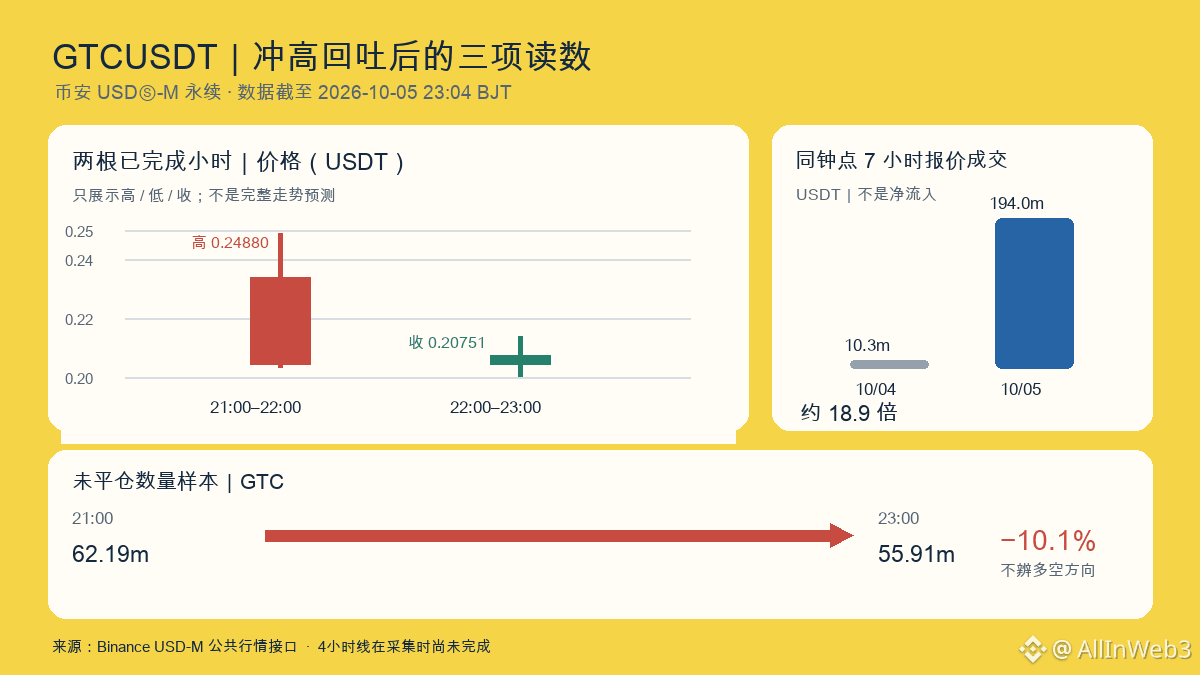
First, the completed candles: From 21:00 to 22:00, the price reached a high of 0.24880 but closed at 0.20432, about 12.7% below the open. It then closed at 0.20751 from 22:00 to 23:00, only about 1.6% above the previous hour’s close, with an intraperiod low of 0.20031. The upper wick on the prior candle indicates clear selling pressure at higher levels, but a single candle cannot confirm a trend reversal; the modest gain in the following candle is not yet a recovery.
Trading volume did increase substantially: quoted trading volume for the seven completed hours from 16:00 to 23:00 on October 5 was approximately $194 million, compared with about $10.29 million during the same hours on October 4, roughly 18.9 times higher. This indicates a jump in trading activity, not net buying or net inflows. Open-interest samples fell from about 62.19 million tokens at 21:00 to about 55.91 million at 23:00, a decline of roughly 10.1%. This is consistent with positions shrinking, but does not show which side—longs or shorts—was closing, nor can OI alone explain the reason for the pullback.
I found no verifiable new Gitcoin announcement synchronized with this price move; earlier governance discussions should not be treated as a catalyst for this move. The four-hour candle from 20:00 to 24:00 had not yet closed when the data was collected. Next, watch whether the next completed hourly candle can reclaim 0.21370 and whether OI stops falling. If the close breaks below 0.20031, the modest rebound that has just appeared will need to be reassessed. The current evidence points more to a spike and pullback amid high volatility, alongside shrinking open interest; it does not confirm a move worth chasing. #GTC
Short-term view: Wait and see; don’t chase a rebound after a sharp surge. In the full 23:01 BJT rankings, $GTC ranked first by gain, up 71.662% over the rolling 24 hours. A rescan at 23:10 before publication still ranked it first, with the reading at +77.377%, a quote of 0.211930, and quoted trading volume of approximately $549.9 million. Rolling-window figures change quickly and are not fixed readings. Compared with the earlier post at 16:16, the key additions this time are not another mention of the “sharp rise,” but the hourly closes after the spike and pullback, same-time trading-volume comparisons, and changes in open interest.
First, the completed candles: From 21:00 to 22:00, the price reached a high of 0.24880 but closed at 0.20432, about 12.7% below the open. It then closed at 0.20751 from 22:00 to 23:00, only about 1.6% above the previous hour’s close, with an intraperiod low of 0.20031. The upper wick on the prior candle indicates clear selling pressure at higher levels, but a single candle cannot confirm a trend reversal; the modest gain in the following candle is not yet a recovery.
Trading volume did increase substantially: quoted trading volume for the seven completed hours from 16:00 to 23:00 on October 5 was approximately $194 million, compared with about $10.29 million during the same hours on October 4, roughly 18.9 times higher. This indicates a jump in trading activity, not net buying or net inflows. Open-interest samples fell from about 62.19 million tokens at 21:00 to about 55.91 million at 23:00, a decline of roughly 10.1%. This is consistent with positions shrinking, but does not show which side—longs or shorts—was closing, nor can OI alone explain the reason for the pullback.
I found no verifiable new Gitcoin announcement synchronized with this price move; earlier governance discussions should not be treated as a catalyst for this move. The four-hour candle from 20:00 to 24:00 had not yet closed when the data was collected. Next, watch whether the next completed hourly candle can reclaim 0.21370 and whether OI stops falling. If the close breaks below 0.20031, the modest rebound that has just appeared will need to be reassessed. The current evidence points more to a spike and pullback amid high volatility, alongside shrinking open interest; it does not confirm a move worth chasing. #GTC