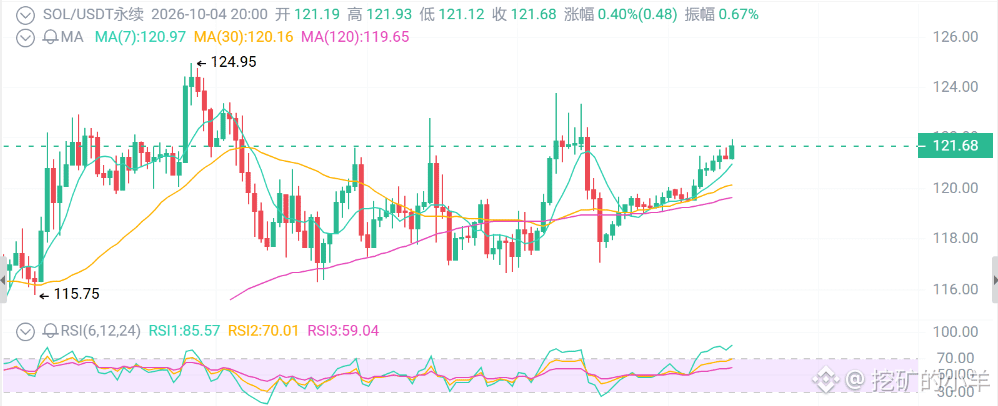
$121 SOL—are you going to chase it?
First, look at the surface: the price is above all major moving averages. The 50-day MA is 105, and the 200-day MA is 86. In August it rose 41%, in September 15%, and in October it has formed a 117–125 range. RSI is in a strong zone, but it’s no longer expanding. The 24-hour range is only about $2, with volume drying up right against the 121.9–122.7 “wall.”
What the daily chart tells you: the bulls haven’t broken. What the 4-hour chart tells you: the buying hasn’t arrived.
First thing: ETF inflows have stopped—this is the most painful signal.
In the prior week, spot SOL ETF inflows were $188 million; in the previous week, only $800,000 came in.
From $188M to $0.8M—this isn’t just slowing down; it’s a cliff.
Cumulative net inflows are still above $1.6B. Bitwise’s BSOL is still the biggest share, but the slope of continuous inflows has broken.
Earlier, every week brought in new money worth hundreds of millions to lift the ride. Now the driver’s gone—only the people inside the carriage are staring at each other.
Second thing: macro isn’t giving SOL a chance for an independent trend.
SOL is priced with the same playbook as BTC. The probability of a rate hike in October dropped from 66% to 22–40%—sounds bullish? But the 10-year U.S. Treasury yield is still around 5.3%, and soft data hasn’t pushed the long end down.
BTC is at 85,200, stuck in the upper half of the 83,000–87,200 box. SOL has been nearly flat over the past week: +1.4% in 24 hours, moving in sync with BTC with no independent setup.
Three hard events are coming next: Oct 14 CPI, Oct 28 FOMC, and Oct 29 PCE.
If BTC effectively breaks below 83,800, it’ll be very hard for SOL’s 117 level to hold on its own.
Third thing: technically, shrinking volume pressing against resistance—the worst scenario is a sudden surge in volume that dumps.
After the failure at 123.8 on Oct 2, SOL has been consolidating inside the platform.
If the daily close stands above 125 and holds, that would upgrade the repair. If the close falls back below 117 and the platform breaks down, the next levels are 116.5 / 113.
A daily move of $3–5 is common. From 121 to 117, or from 121 to 125—either could hit within one to two days.
Trading strategy
1. Wait for the 4-hour close to hold above 122.7 with increased volume, then reassess 124–125. Stop-loss: reclaim/close back below 120. Only discuss 130 once above 125.
2. Pullback long. Prefer waiting for 117–118 to show a reversal signal with long lower wicks, then buy in batches. Stop-loss below 115.5. First target: back to 122; once it stabilizes, look again at 125.
3. Short only when rejected on the bounce. If it rallies into 124–125 with increased volume and a bearish upper wick, and the 4-hour chart can’t reclaim it, short with a light position. Stop-loss above 126.5. Targets: 119.5 / 117.
4. Invalidation conditions. If the daily close breaks below 117, pull the long positions. If the ETF continues to approach near-zero inflows, downgrade the breakout longs above 125. If BTC effectively breaks below 83,800, reduce leverage.
First, look at the surface: the price is above all major moving averages. The 50-day MA is 105, and the 200-day MA is 86. In August it rose 41%, in September 15%, and in October it has formed a 117–125 range. RSI is in a strong zone, but it’s no longer expanding. The 24-hour range is only about $2, with volume drying up right against the 121.9–122.7 “wall.”
What the daily chart tells you: the bulls haven’t broken. What the 4-hour chart tells you: the buying hasn’t arrived.
First thing: ETF inflows have stopped—this is the most painful signal.
In the prior week, spot SOL ETF inflows were $188 million; in the previous week, only $800,000 came in.
From $188M to $0.8M—this isn’t just slowing down; it’s a cliff.
Cumulative net inflows are still above $1.6B. Bitwise’s BSOL is still the biggest share, but the slope of continuous inflows has broken.
Earlier, every week brought in new money worth hundreds of millions to lift the ride. Now the driver’s gone—only the people inside the carriage are staring at each other.
Second thing: macro isn’t giving SOL a chance for an independent trend.
SOL is priced with the same playbook as BTC. The probability of a rate hike in October dropped from 66% to 22–40%—sounds bullish? But the 10-year U.S. Treasury yield is still around 5.3%, and soft data hasn’t pushed the long end down.
BTC is at 85,200, stuck in the upper half of the 83,000–87,200 box. SOL has been nearly flat over the past week: +1.4% in 24 hours, moving in sync with BTC with no independent setup.
Three hard events are coming next: Oct 14 CPI, Oct 28 FOMC, and Oct 29 PCE.
If BTC effectively breaks below 83,800, it’ll be very hard for SOL’s 117 level to hold on its own.
Third thing: technically, shrinking volume pressing against resistance—the worst scenario is a sudden surge in volume that dumps.
After the failure at 123.8 on Oct 2, SOL has been consolidating inside the platform.
If the daily close stands above 125 and holds, that would upgrade the repair. If the close falls back below 117 and the platform breaks down, the next levels are 116.5 / 113.
A daily move of $3–5 is common. From 121 to 117, or from 121 to 125—either could hit within one to two days.
Trading strategy
1. Wait for the 4-hour close to hold above 122.7 with increased volume, then reassess 124–125. Stop-loss: reclaim/close back below 120. Only discuss 130 once above 125.
2. Pullback long. Prefer waiting for 117–118 to show a reversal signal with long lower wicks, then buy in batches. Stop-loss below 115.5. First target: back to 122; once it stabilizes, look again at 125.
3. Short only when rejected on the bounce. If it rallies into 124–125 with increased volume and a bearish upper wick, and the 4-hour chart can’t reclaim it, short with a light position. Stop-loss above 126.5. Targets: 119.5 / 117.
4. Invalidation conditions. If the daily close breaks below 117, pull the long positions. If the ETF continues to approach near-zero inflows, downgrade the breakout longs above 125. If BTC effectively breaks below 83,800, reduce leverage.