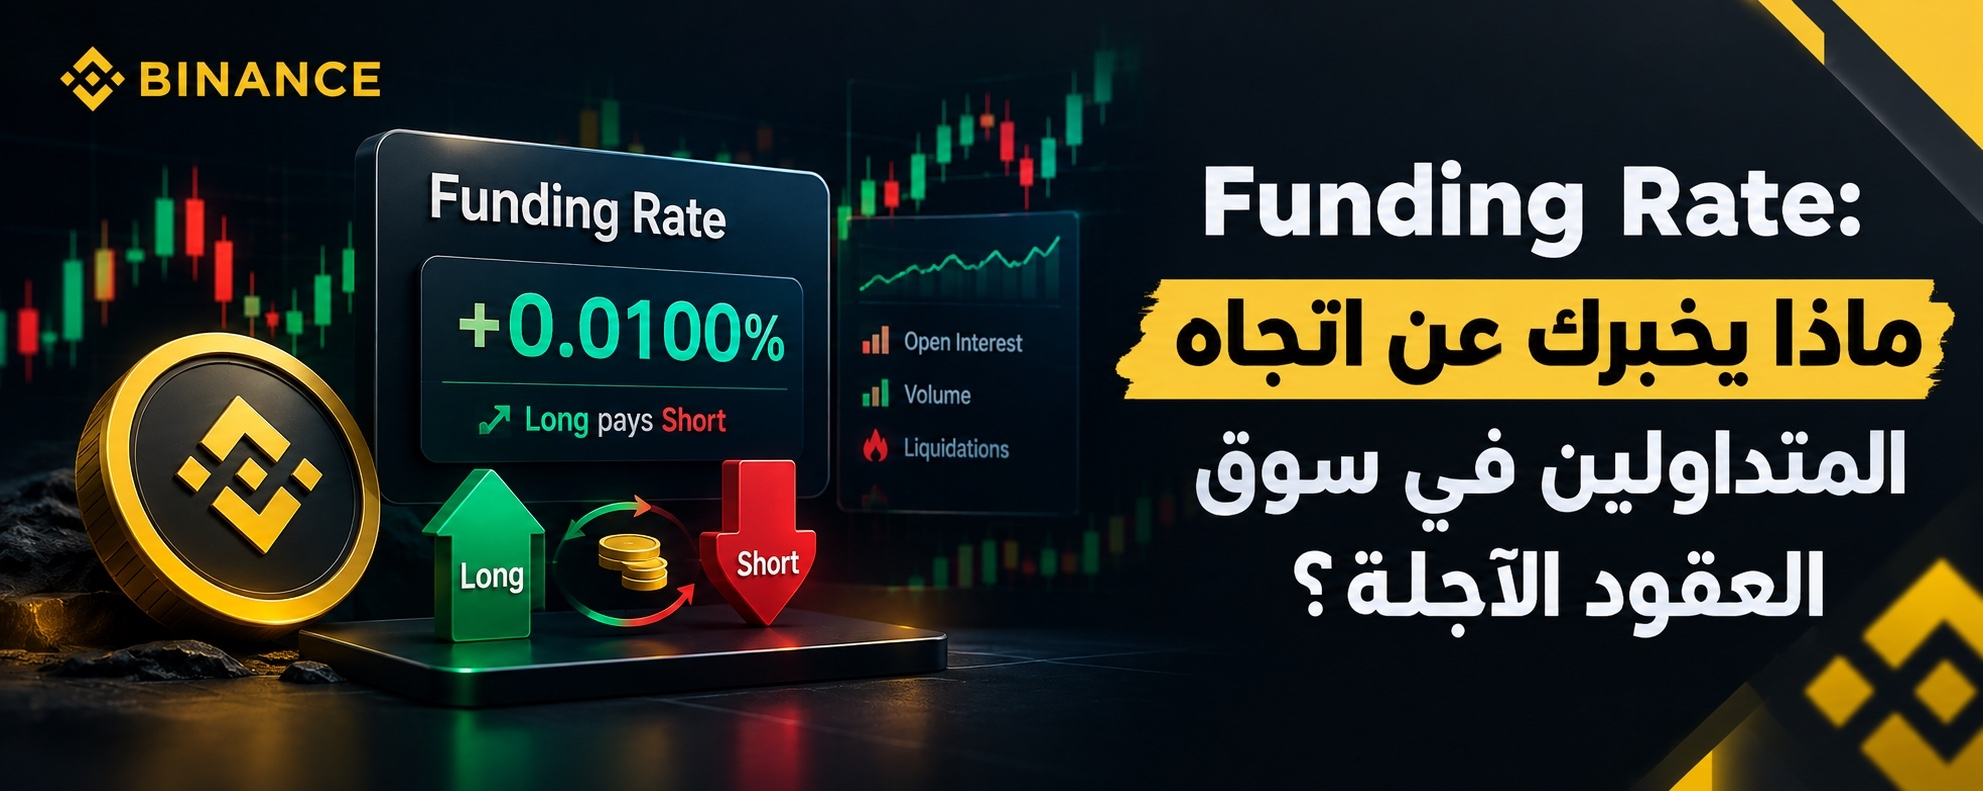

If you’re trading futures, one of the indicators you should know well is the Funding Rate.
Many traders see the Funding Rate as positive or negative, then interpret it directly as a buy or sell signal.
But using it this way may lead to wrong conclusions.
What is Funding Rate?
Funding Rate is a periodic rate used in perpetual futures contracts to help keep the contract price close to the spot price of the underlying asset.
In simplified terms:
When the Funding Rate is positive, Long position holders typically pay funding fees to Short position holders.
And when it’s negative, the opposite usually happens; i.e., Short position holders pay Long position holders.
The payment mechanism and the time period differ by exchange and contract, so you should always refer to the contract details.
What does a positive Funding Rate mean?
When Funding Rate is positive, it means that Long positions pay funding to Short positions.
This could be a sign of relatively higher demand for long positions or an increased cost of holding them.
But:
A positive Funding Rate does not mean the price will go down.
The price could be moving strongly upward while funding remains positive.
What does a negative Funding Rate mean?
When Funding Rate is negative, Short position holders pay funding to Long position holders.
This may indicate an increase in relative demand for short positions.
But also:
A negative Funding Rate does not mean the price will go up.
The market can keep falling despite negative funding.
When does Funding Rate become more important?
The real value shows up when you don’t look at Funding Rate alone.
For example:
Price rises + Open Interest rises + Funding Rate rises
This could mean that market participation increases as short positions become more crowded.
If funding becomes extremely high, these positions may become more expensive and more sensitive to any reversal move.
As for:
Price falls + Open Interest rises + Funding Rate falls
It may indicate an increase in participation in short positions alongside a drop.
But this is not a definite signal that the trend will continue.
Does a high Funding Rate mean the price will reverse?
Not necessarily.
And this is one of the most common misconceptions.
If Funding Rate is positive and high, this does not automatically mean the market will go down.
The uptrend may continue for a long time despite rising funding costs.
But when funding becomes very high at the same time as:
A strong, fast price increase
A clear rise in Open Interest
A big increase in leveraged positions
The market reaches an important resistance level
Then it can be useful to pay attention to the risks of position overcrowding and the possibility of a sharp move when the direction changes.
Funding Rate and Short Squeeze
Funding Rate can also be used to understand some scenarios of short-position pressure.
If funding is negative and the market is crowded with short positions, then the price starts rising strongly, some of these positions may get liquidated.
Liquidations can add extra buying pressure, leading to a faster rise in price.
This is one of the scenarios that can develop into a Short Squeeze.
Don’t use Funding Rate alone
The best approach is to combine it with other indicators.
Watch:
Price + Funding Rate + Open Interest + Volume + Liquidations
For example, a rise in price alone gives you limited information.
But if you see at the same time:
Price ↑
Open Interest ↑
Funding Rate ↑
Liquidations are high
So you’re looking at a more complex picture that deserves analysis instead of making a decision based on a single indicator.
A common mistake to avoid
It’s wrong to treat Funding Rate as if it directly gives you the market direction.
High Funding Rate does not mean:
“The market will go down.”
And a low Funding Rate does not mean:
“The market will go up.”
The indicator mainly tells you about funding costs and relative imbalance in perpetual contract positions, not the future direction of the price.
Summary
Funding Rate is not a button that tells you:
Long = buy
Or:
Short = sell
It’s an indicator that helps you understand the cost of holding positions and how crowded the market is on one side.
And the more you combine it with Open Interest, price movement, trading volume, and Liquidations data, the better your picture of the futures market condition.
The content is educational and not a recommendation to buy or sell.

$AAPLB #تداول_العملات_المشفرة #بايننس #إدارة_المخاطر $MSFTB