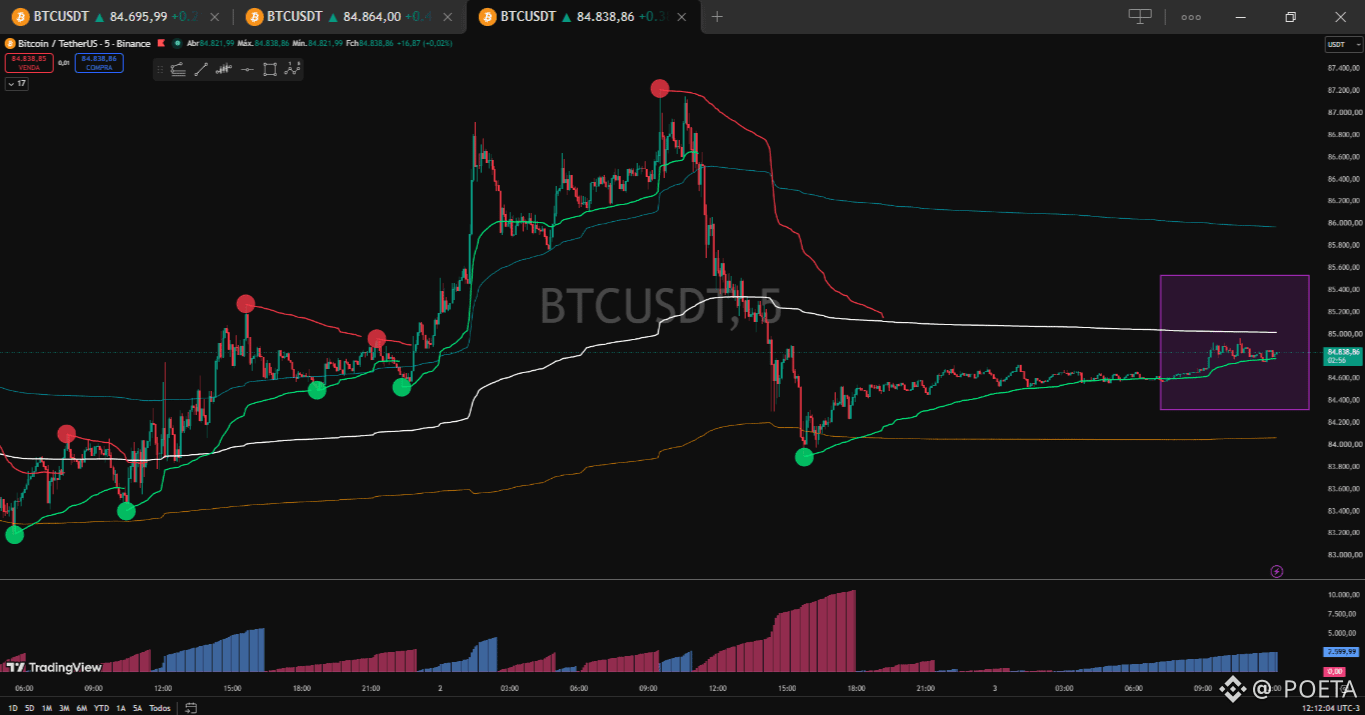
🙇🏻The BTCUSDT chart in a 5-minute timeframe shows the price consolidating within a sideways range (highlighted in purple), trading very close to the central white VWAP. This area acts as a turning point and a price-attraction zone, reflecting a moment of market hesitation after the last low was recovered.↕️
The Weis Wave💹 indicator in the lower panel confirms this scenario by showing weak volume, indicating low buying pressure to break the VWAP meaningfully. Since no red signal has appeared indicating strong seller-flow entry, the short-term trend remains in consolidation, waiting for a volume breakout.🔴
Watch the previous video: 😎🙌🏻✨
https://app.binance.com/uni-qr/cvid/373296884880193?r=FB8MOKGZ&l=pt-PT&uco=CM8a-ICidTDEK2O8iiaoPg&uc=app_square_share_link&us=copylink
The Weis Wave💹 indicator in the lower panel confirms this scenario by showing weak volume, indicating low buying pressure to break the VWAP meaningfully. Since no red signal has appeared indicating strong seller-flow entry, the short-term trend remains in consolidation, waiting for a volume breakout.🔴
Watch the previous video: 😎🙌🏻✨
https://app.binance.com/uni-qr/cvid/373296884880193?r=FB8MOKGZ&l=pt-PT&uco=CM8a-ICidTDEK2O8iiaoPg&uc=app_square_share_link&us=copylink