ENA/USDT Analysis — 4h Chart (03/10/2026)
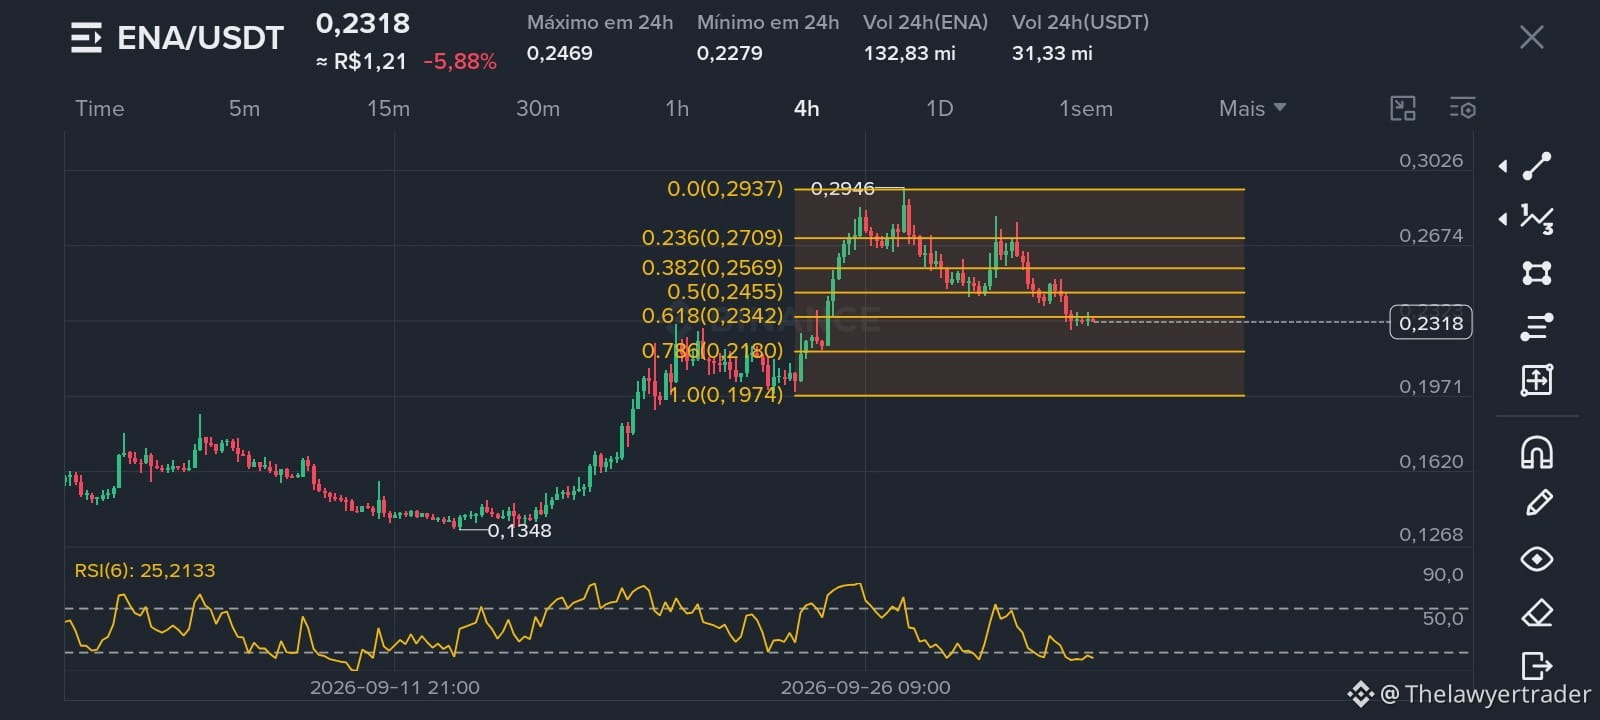
ENA/USDT is currently trading at 0.2318 USDT, in a correction after the recent peak in the 0.2946 region, with a 5.88% drop over the last 24 hours.
Chart pattern: the price pulled back and is now testing the area just below the 0.618 Fibonacci retracement level (0.2342), which acts as immediate resistance. The closest support is at the 0.786 level (0.2180).
Indicators: the RSI (6) is at 25.21, indicating an oversold condition (below 30). This suggests exhaustion of selling pressure in the short term, increasing the likelihood of a technical rebound or a consolidation phase before a directional decision.
Probability: the oversold reading combined with proximity to Fibonacci supports gives a moderate probability of a recovery move in the short term, but the broader trend remains corrective. A close above 0.2342 would open room to test higher resistances; on the other hand, a loss of 0.2180 could accelerate the decline.
Consideration: technical analysis is probabilistic, not a guarantee of results. I recommend caution, risk management, and confirmation of the move before any decision. Not investment advice.
#ENAAnalysis #ENAUSDT🚨 $ENA
ENA/USDT is currently trading at 0.2318 USDT, in a correction after the recent peak in the 0.2946 region, with a 5.88% drop over the last 24 hours.
Chart pattern: the price pulled back and is now testing the area just below the 0.618 Fibonacci retracement level (0.2342), which acts as immediate resistance. The closest support is at the 0.786 level (0.2180).
Indicators: the RSI (6) is at 25.21, indicating an oversold condition (below 30). This suggests exhaustion of selling pressure in the short term, increasing the likelihood of a technical rebound or a consolidation phase before a directional decision.
Probability: the oversold reading combined with proximity to Fibonacci supports gives a moderate probability of a recovery move in the short term, but the broader trend remains corrective. A close above 0.2342 would open room to test higher resistances; on the other hand, a loss of 0.2180 could accelerate the decline.
Consideration: technical analysis is probabilistic, not a guarantee of results. I recommend caution, risk management, and confirmation of the move before any decision. Not investment advice.
#ENAAnalysis #ENAUSDT🚨 $ENA