$BTC 📊 STRUCTURAL MARKET REPORT AND MACROECONOMIC CONTEXT ⚡
1. GENERAL STATUS AND TECHNICAL STRUCTURE 🟢
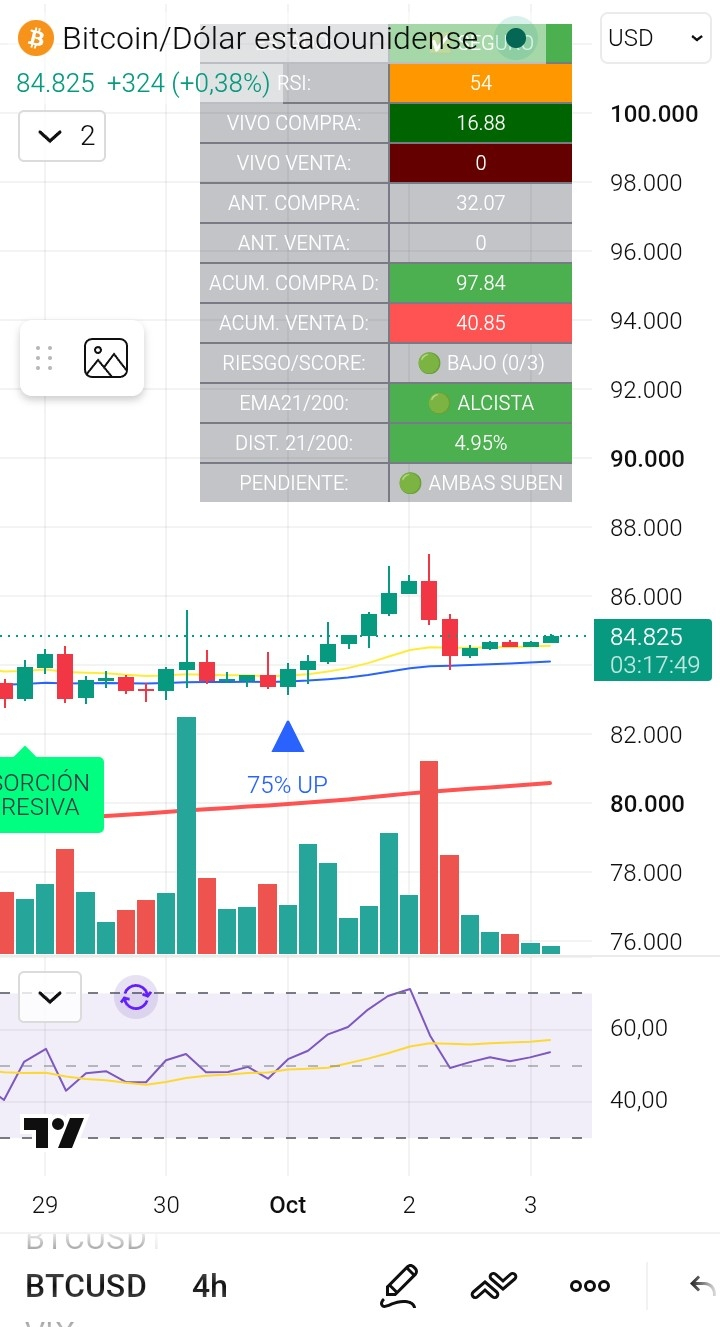
The market maintains a solidly bullish structure, trading steadily in the $84,825 area.
JPG
The systemic risk indicator shows a LOW level (0/3), confirming that the underlying trend remains intact with no structural deterioration.
JPG
The main moving averages maintain a clear positive bias, projecting an upward slope in sync while keeping a healthy 4.95% distance between them.
JPG
Momentum is at an optimal restart point: the RSI is at 54, sitting in neutral territory. This shows the asset has cleared any overbought excess and has the space needed to start a new impulse without overextending.
JPG
The intraday order flow reveals absolute control of demand: buy accumulation stands at 97.84 versus weak sell accumulation of 40.85. It also highlights that real-time selling pressure is zero (0).
JPG
2. MACRO IMPACT AND FUNDAMENTAL NEWS 📰
The recent market turmoil was directly catalyzed by extremely weak U.S. economic data: non-farm payrolls reported only 29,000 new jobs, a massive drop versus the estimated 90,000 and far below the 133,000 from the prior reading.
JPG
Additionally, wage growth stalled at 0.1% per month (vs. the 0.3% projected) and 3% year over year.
JPG
News Consequence: These recessionary indicators have forced monetary authorities to change their tone, collapsing the odds of further interest-rate tightening from 73% to just 44%. This expectation of greater global liquidity acts as a strong bullish driver for the asset.
3. INSTITUTIONAL FLOW AND SEASONALITY 🐋
Valuation Update: Top-tier financial institutions have drastically raised the asset’s 12-month price target, moving from the $82,000 mark to a new level of $113,000 (a projected jump of 38%).
Return of Capital: The net inflow of institutional liquidity via exchange-traded funds is confirmed, recording inflows of +$102.7 million and reversing the strong outflows from the previous session.
Historical Seasonality: Current price behavior confirms the start of the strong positive seasonal pattern that statistically characterizes the final quarter of the year.
4. KEY ZONE MAP AND PROJECTIONS 🎯
🛡️ Defense Zone (Institutional Support): The $82,000 to $82,500 band has been confirmed as the foundation of the move. At this floor, signals of "Aggressive Absorption" and "75% UP" were triggered, showing that large capital strongly bought the drop on the news.
JPG
⚔️ Break Zone (Resistance): The immediate block to break through and consolidate is located between $85,000 and $85,600.
🚀 Projected Targets: With an ongoing technical continuation pattern, breaking above resistance paves the way to a base seasonal target of $87,000. If institutional volume supports it, the macroeconomic target extends toward the $90,800 to $92,000 range.
5. SHORT-TERM SCENARIO MATRIX 🎲
🟢 Continuation (Higher Probability): The buy flow sustains the momentum, breaking above $85,600 and accelerating toward the first bullish targets.
🟡 Consolidation (Medium Probability): The price is developing a healthy sideways range between $83,000 and $85,500 to accumulate energy and allow the market to digest the macroeconomic news before continuing.
🔴 New Test (Lower Probability): In case of any unexpected rebound in traditional yields, the price could temporarily pull back to re-test the absorption zone at $82,000.