🚨 TRADER ALERT: A WHALE IS “SCANNING” TWO ENORMOUS LIQUIDITY ZONES! 🚨
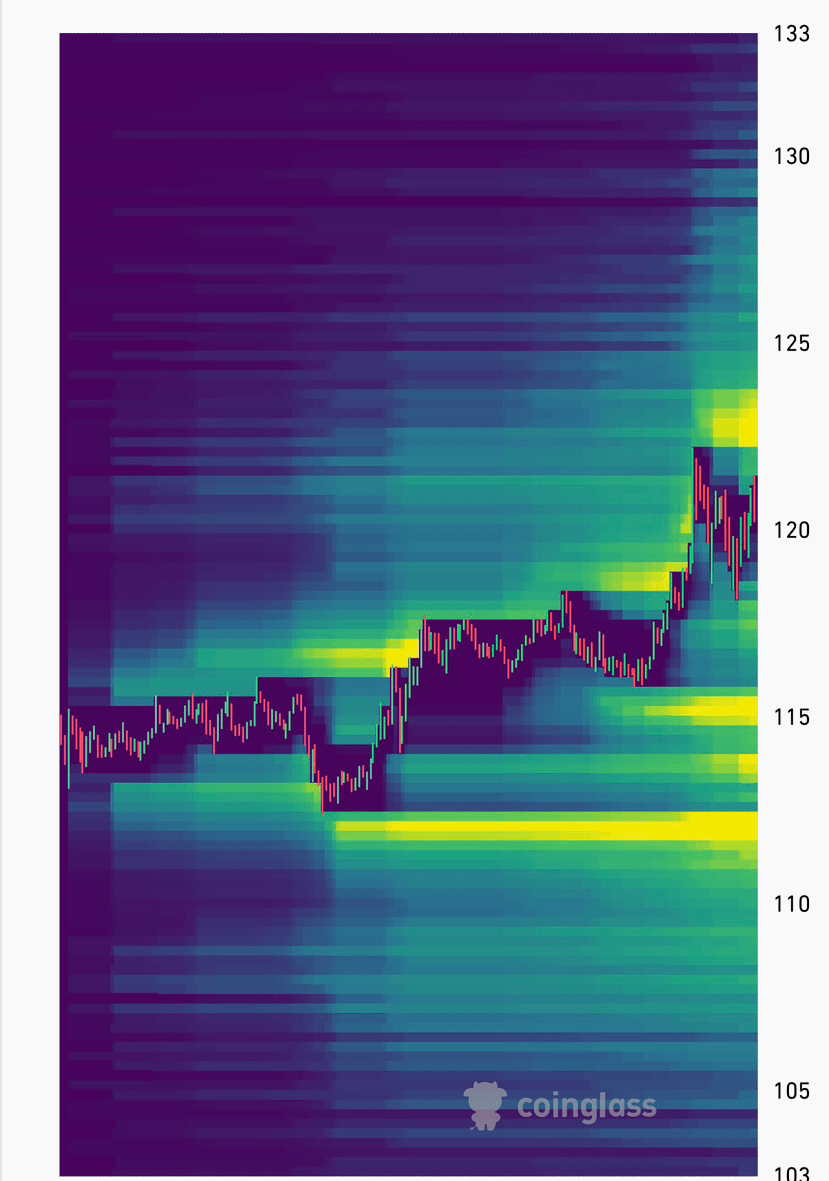
The latest Heatmap chart shows price moving within an ascending structure, but surrounding it are extremely sensitive liquidity bands (bright yellow) that absolutely leveraged traders cannot ignore!
📍 Analysis of the “hot” zones:
* Upper resistance zone (122 – 124): Short liquidity walls are concentrated right next to the current price (around 121 – 122). Just a small push could send price soaring to wipe out all Stop Losses for the Short side.
* Lower support cushion (113 – 115): The Long liquidity band is extremely dense, seemingly “waiting” below. If price reverses and dumps strongly down here to clean out high-leverage Long positions, the risk is very high.
⚠️ Risk scenario to note:
The market shows signs of pushing prices higher to lure the Long side into FOMO—then it’s very likely to unleash a brutal two-sided sweep: push up to hit 123–124 to kill Shorts → then sharply drop to 113–115 to liquidate Longs.#sol
💡 Safer trading suggestions:
* Don’t close Short/Long too hastily: Don’t place Stop Losses too close to the sensitive levels of 115 and 123.
* Reduce leverage: Lower Volume and Margin to the safest level possible.#solana
* Wait for clear signals: Limit overtrading in this “squeeze” price range; prioritize patience—wait until price sweeps clean one of the two yellow bands before considering entry.
Safety comes first—protecting your capital matters more than chasing short-term profits, folks! 📉📈$SOL
The latest Heatmap chart shows price moving within an ascending structure, but surrounding it are extremely sensitive liquidity bands (bright yellow) that absolutely leveraged traders cannot ignore!
📍 Analysis of the “hot” zones:
* Upper resistance zone (122 – 124): Short liquidity walls are concentrated right next to the current price (around 121 – 122). Just a small push could send price soaring to wipe out all Stop Losses for the Short side.
* Lower support cushion (113 – 115): The Long liquidity band is extremely dense, seemingly “waiting” below. If price reverses and dumps strongly down here to clean out high-leverage Long positions, the risk is very high.
⚠️ Risk scenario to note:
The market shows signs of pushing prices higher to lure the Long side into FOMO—then it’s very likely to unleash a brutal two-sided sweep: push up to hit 123–124 to kill Shorts → then sharply drop to 113–115 to liquidate Longs.#sol
💡 Safer trading suggestions:
* Don’t close Short/Long too hastily: Don’t place Stop Losses too close to the sensitive levels of 115 and 123.
* Reduce leverage: Lower Volume and Margin to the safest level possible.#solana
* Wait for clear signals: Limit overtrading in this “squeeze” price range; prioritize patience—wait until price sweeps clean one of the two yellow bands before considering entry.
Safety comes first—protecting your capital matters more than chasing short-term profits, folks! 📉📈$SOL