$龙虾 要爆多还是爆空?米格撕开主力底牌:这波反弹是馅饼还是陷阱!
K-lines are drawn for retail traders; the fund flow is what the main force’s heart monitor looks like!
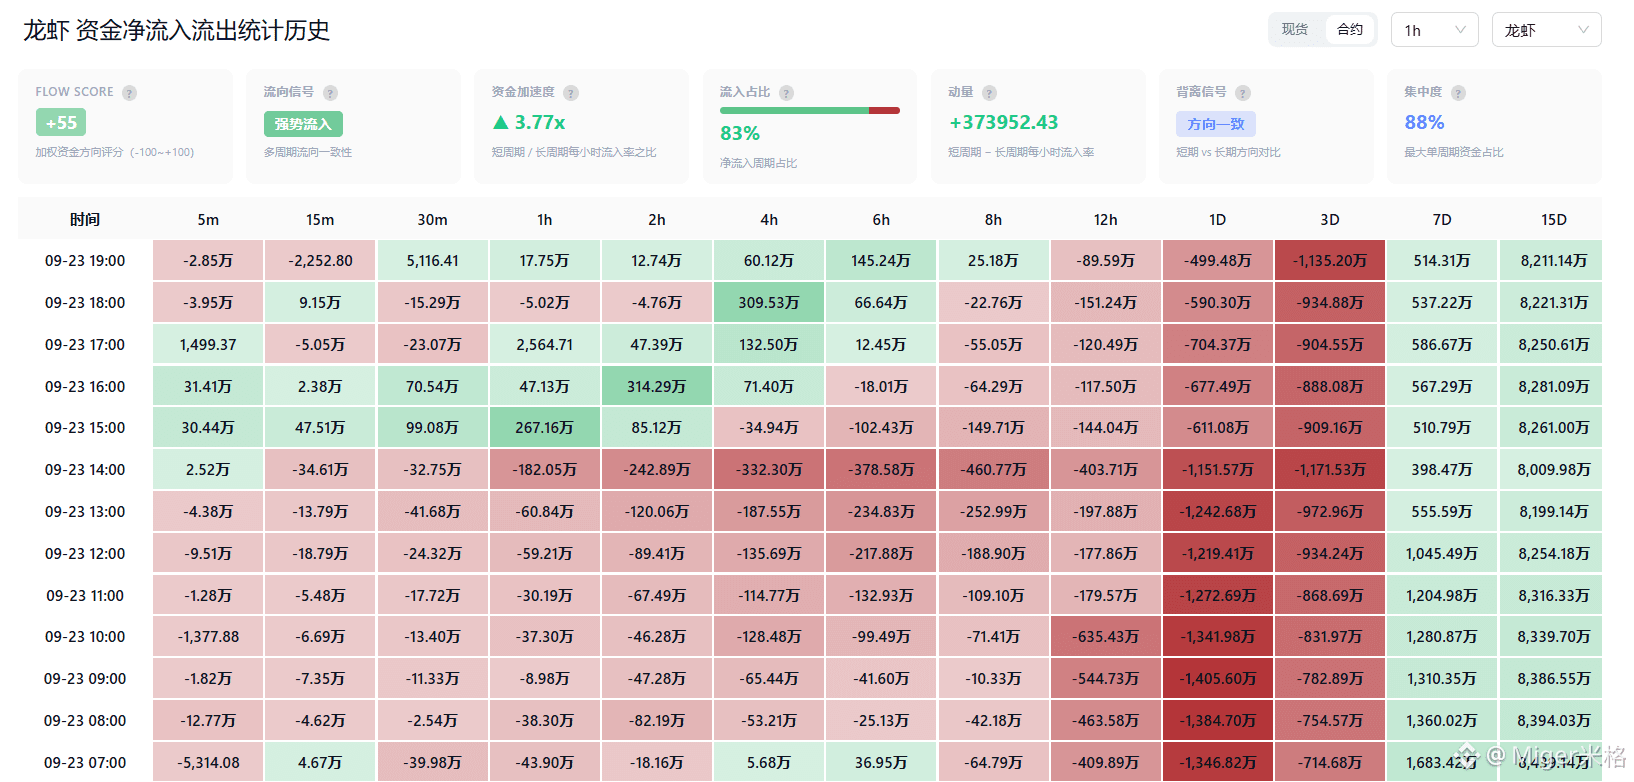
Today, the lobster pulled up an hourly bullish candle—from 0.135 to 0.176. It looks pretty powerful, right? But Mig has to pour cold water on it! Look at the fund flow chart—net inflow of 175,500 in 1 hour, 600,000 in 4 hours. On the surface, it really looks like money is coming in. But across a 3-day window, the net flow is -11.35 million; over 7 days, it’s -5.14 million! Short longs and long shorts—this is the classic "pump-and-dump" rhythm!
Also check the data from 100-million-Coin Finance: net inflow for the entire market is -510,200. That means capital is moving around across the whole market. Those short-cycle inflows are basically the main force moving money from its left hand to its right—creating the illusion of "someone is buying" to trick you into entering and becoming the bag holder.
On-chain data has already written it—two wallets control 54.5%, and the order book depth is extremely thin. The price is basically lifted by derivatives contracts. In this kind of market, once the main force withdraws liquidity, the breakdown won’t even give you time to react.
Trading advice: Build a short position now. First target is 0.14. If it breaks down, add to the position and look at 0.12. For the brothers who want to go long—wait until the daily chart holds above 0.2 before talking about the trend. Chasing longs right now is handing the main force bullets to shoot you with. On the news front, the OpenClaw concept was hit hard across the board today; the Hong Kong AI sector fell across the board as well, and the narrative didn’t provide any ammunition.
Want to know at what price the main force will strike next? Follow Mig and get real-time analysis on the next key K-line’s bullish-bearish watershed! #AI股持续上涨还有哪些投资机会 #21Shares推出欧洲首只Zcash实物ETP #Cardano接入x402支付标准
K-lines are drawn for retail traders; the fund flow is what the main force’s heart monitor looks like!
Today, the lobster pulled up an hourly bullish candle—from 0.135 to 0.176. It looks pretty powerful, right? But Mig has to pour cold water on it! Look at the fund flow chart—net inflow of 175,500 in 1 hour, 600,000 in 4 hours. On the surface, it really looks like money is coming in. But across a 3-day window, the net flow is -11.35 million; over 7 days, it’s -5.14 million! Short longs and long shorts—this is the classic "pump-and-dump" rhythm!
Also check the data from 100-million-Coin Finance: net inflow for the entire market is -510,200. That means capital is moving around across the whole market. Those short-cycle inflows are basically the main force moving money from its left hand to its right—creating the illusion of "someone is buying" to trick you into entering and becoming the bag holder.
On-chain data has already written it—two wallets control 54.5%, and the order book depth is extremely thin. The price is basically lifted by derivatives contracts. In this kind of market, once the main force withdraws liquidity, the breakdown won’t even give you time to react.
Trading advice: Build a short position now. First target is 0.14. If it breaks down, add to the position and look at 0.12. For the brothers who want to go long—wait until the daily chart holds above 0.2 before talking about the trend. Chasing longs right now is handing the main force bullets to shoot you with. On the news front, the OpenClaw concept was hit hard across the board today; the Hong Kong AI sector fell across the board as well, and the narrative didn’t provide any ammunition.
Want to know at what price the main force will strike next? Follow Mig and get real-time analysis on the next key K-line’s bullish-bearish watershed! #AI股持续上涨还有哪些投资机会 #21Shares推出欧洲首只Zcash实物ETP #Cardano接入x402支付标准