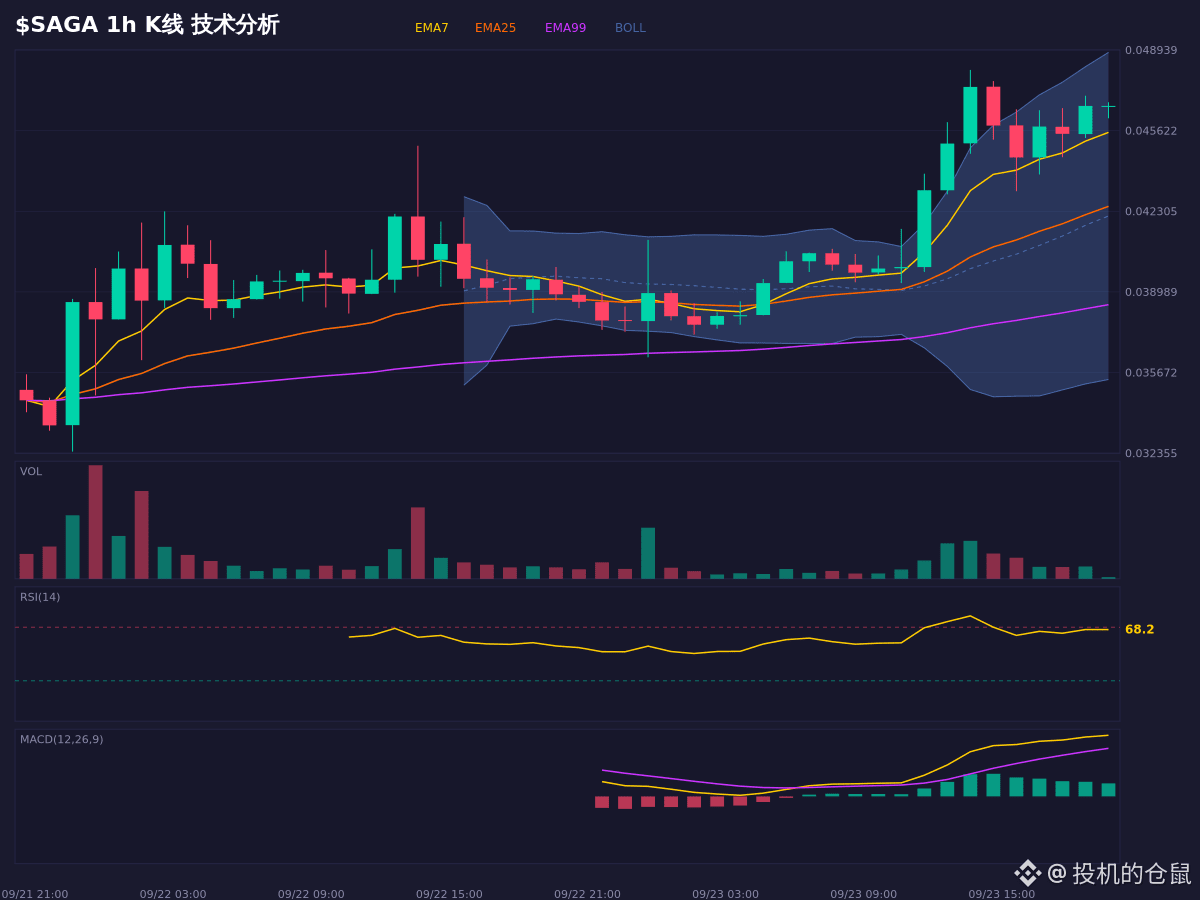
$SAGA This surge is indeed impressive—an increase of 23% has made many “greenhorns” envious, but before chasing higher, you’d better check what the technicals look like.
The most striking is the risk of a top divergence. The price makes a new high, but the RSI doesn’t follow—this is a dangerous signal. Then take a look at Stoch RSI: the K line crosses below the D line, which clearly shows a bearish short-term sentiment. The contradiction is this: on one hand, the moving averages are in a strong bullish alignment; on the other hand, the short-term indicators are all issuing warnings.
The current level, 0.046600, is quite delicate. If it holds and stays firmly within the bullish structure of 0.043605~0.045466, the upward momentum could continue; but if it breaks below 0.039782, then the logic behind the current rally fails.
$SAGA
Just observing the market and scenario-based speculation; not a record of trading operations.
$SAGA #行情分析 #交易 #bear market
The most striking is the risk of a top divergence. The price makes a new high, but the RSI doesn’t follow—this is a dangerous signal. Then take a look at Stoch RSI: the K line crosses below the D line, which clearly shows a bearish short-term sentiment. The contradiction is this: on one hand, the moving averages are in a strong bullish alignment; on the other hand, the short-term indicators are all issuing warnings.
The current level, 0.046600, is quite delicate. If it holds and stays firmly within the bullish structure of 0.043605~0.045466, the upward momentum could continue; but if it breaks below 0.039782, then the logic behind the current rally fails.
$SAGA
Just observing the market and scenario-based speculation; not a record of trading operations.
$SAGA #行情分析 #交易 #bear market