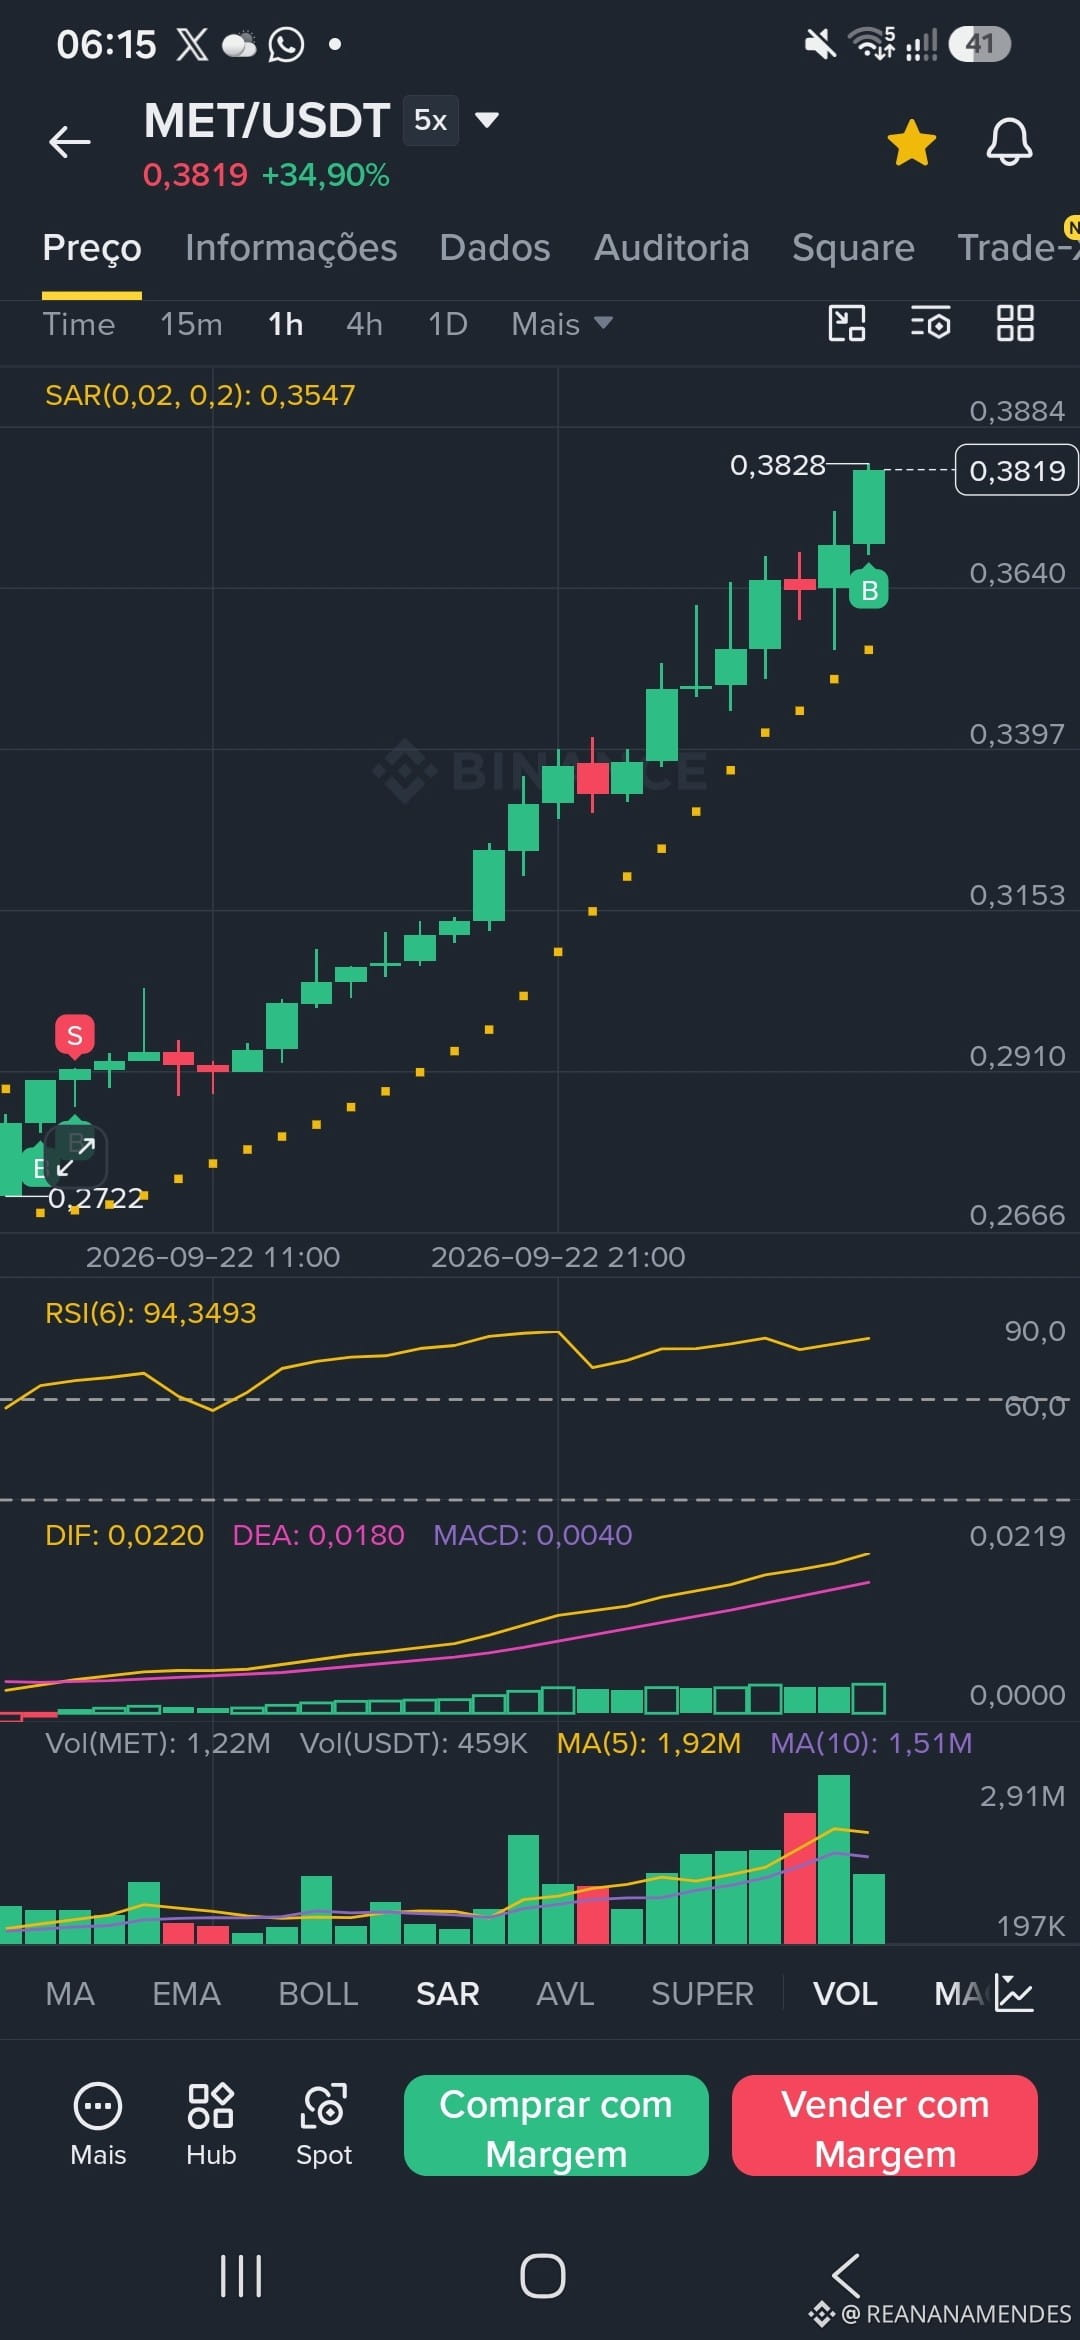
$MET 🧠 Reading the Chart: How we identified the entry at $MET /USDT
When looking at the 1h chart, a few key points stood out:
1️⃣ Parabolic SAR: Below the price, indicating continued bullish momentum.
2️⃣ Volume: A significant increase in buying volume in the last candles.
3️⃣ RSI: Relative strength indicator at an extreme level (>90), showing total dominance by buyers.
Trade executed on isolated/cross margin with discipline. Remember: always follow your risk management plan! 🛡️
#BinanceSquareCommunity #TechnicalAnalysis #TradingView #MET
When looking at the 1h chart, a few key points stood out:
1️⃣ Parabolic SAR: Below the price, indicating continued bullish momentum.
2️⃣ Volume: A significant increase in buying volume in the last candles.
3️⃣ RSI: Relative strength indicator at an extreme level (>90), showing total dominance by buyers.
Trade executed on isolated/cross margin with discipline. Remember: always follow your risk management plan! 🛡️
#BinanceSquareCommunity #TechnicalAnalysis #TradingView #MET