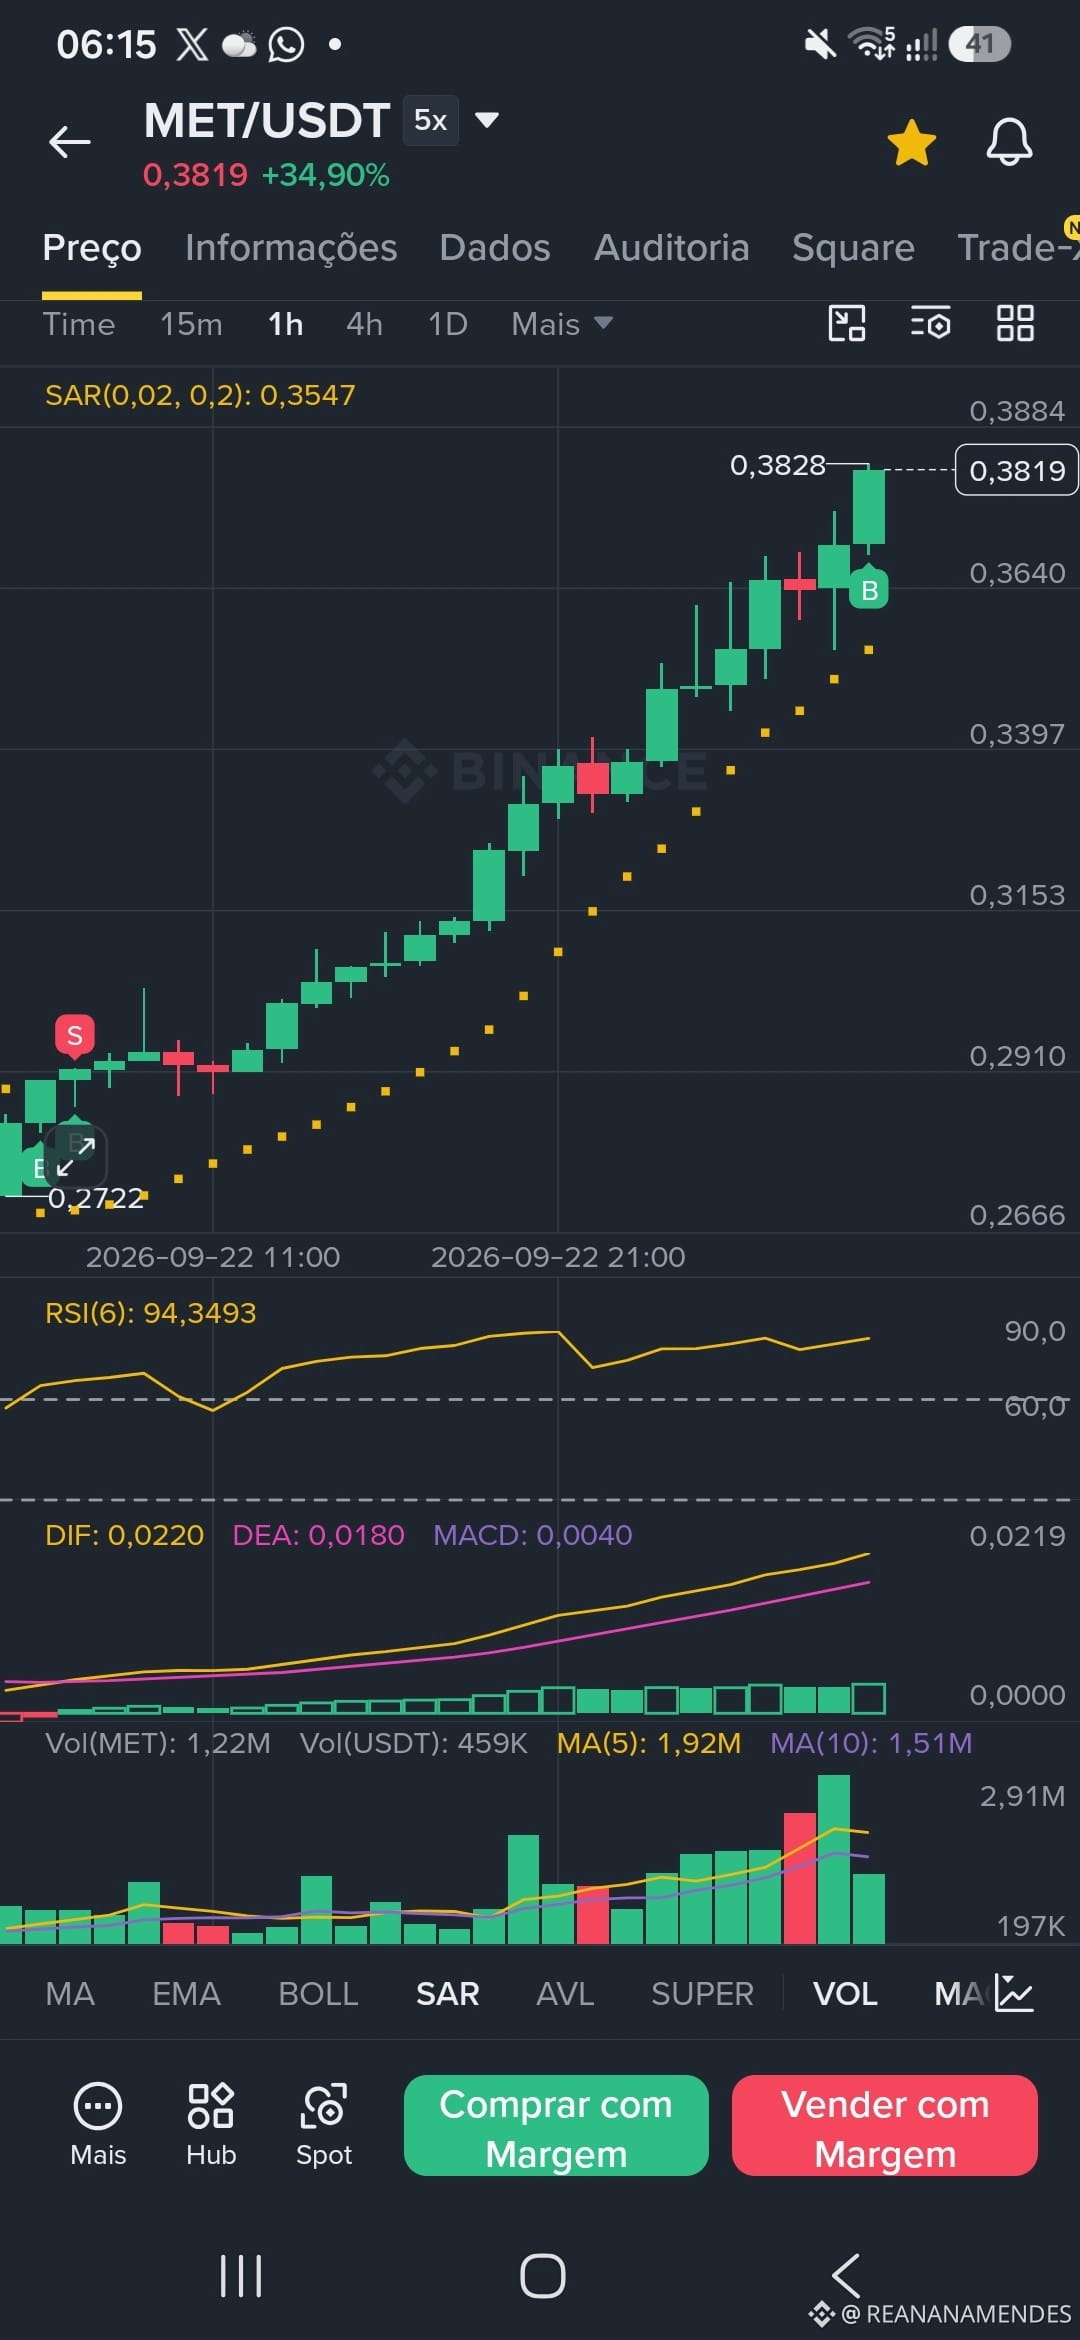
# MET Analyzing the chart in this image, here are the technical details of this trade:
Pair: MET/USDT (Leverage 5x)
Move: Strong Upswing (+34.90% at the time of the breakout)
Signals and Indicators on the Chart:
Buy Point (B): Executed around 0.36 (on the breakout/continuation of the trend).
Parabolic SAR: Yellow dots below the candles confirming an uptrend (bullish trend).
RSI (6): At 94.3, indicating extreme overbought / strong buying power at the top.
MACD / Volume: Strong bullish crossover and rising volume (volume spike).
Pair: MET/USDT (Leverage 5x)
Move: Strong Upswing (+34.90% at the time of the breakout)
Signals and Indicators on the Chart:
Buy Point (B): Executed around 0.36 (on the breakout/continuation of the trend).
Parabolic SAR: Yellow dots below the candles confirming an uptrend (bullish trend).
RSI (6): At 94.3, indicating extreme overbought / strong buying power at the top.
MACD / Volume: Strong bullish crossover and rising volume (volume spike).