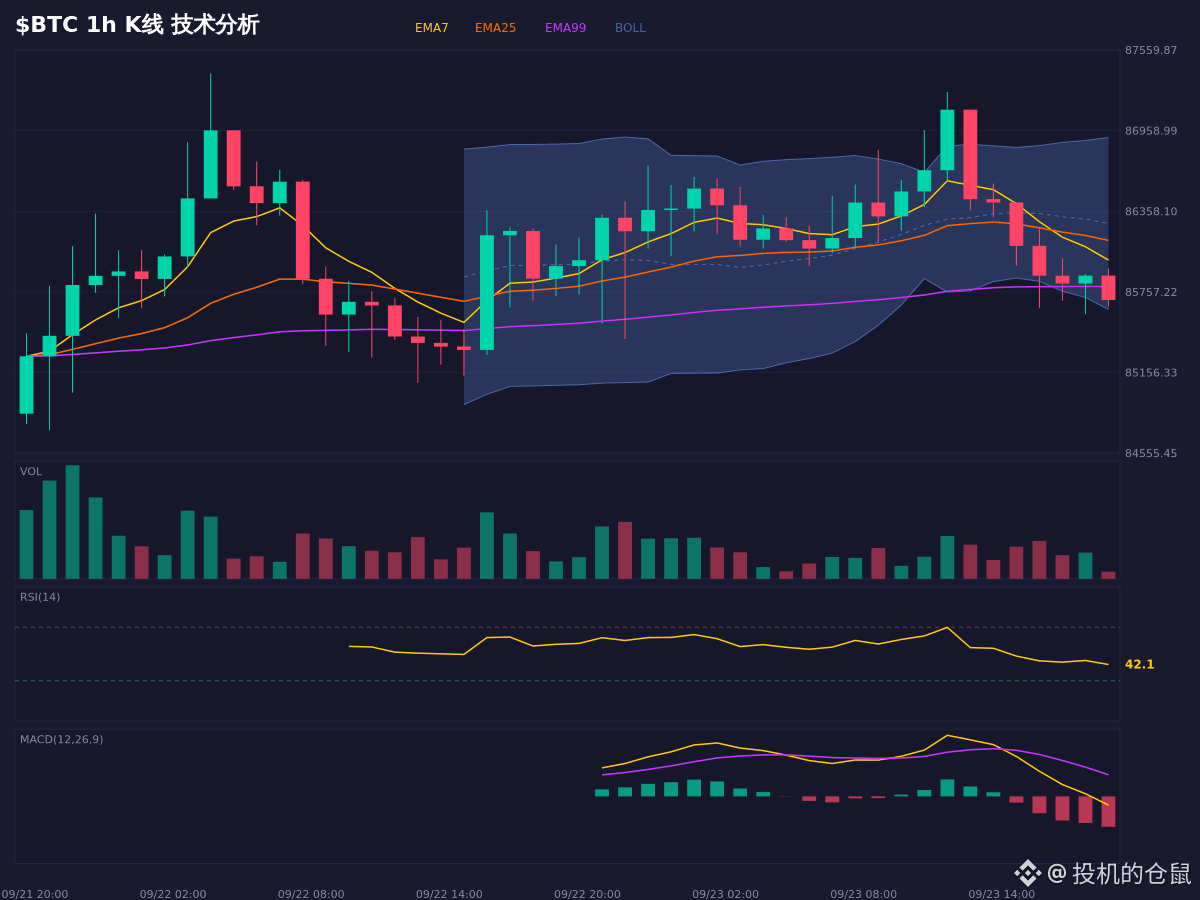
The recent market action is honestly a bit convoluted. The price for $BTC is hovering around 85691, and the 24-hour amplitude doesn’t look that big, yet the trend is quite hard to read.
From the intraday structure, the price is still trading below EMA7 (85993.11) and EMA25 (86122.39). The Bollinger middle band (86266.81) is also pressing above. The OBV energy flow even shows signs of capital outflow. Although the MACD bearish momentum histogram bars are shrinking, the DIF and DEA are still in a bearish alignment. Overall, the short-term tape is indeed on the weak side.
But here’s the interesting part: the Stoch RSI data is classic. Both the K line and D line have dipped to the lower extreme of oversold by about 1.5, which, in principle, makes a short-term rebound more likely. Also, the long-to-short ratio is close to 2 (longs 66.2%), with long positioning still relatively high. The funding rate is also reasonably bullish. This suggests that quite a few participants inside the market are still optimistic about $BTC ’s outlook, which feels somewhat disconnected from the price action—definitely worth paying attention to.
So right now it’s a tug-of-war: the trend looks somewhat weak, while oversold conditions and bullish sentiment are brewing a potential bounce. It creates a contradictory situation. The key question is whether this wave of $BTC can hold ground, turning those bullish sentiments into a real rebound, or whether it keeps dipping to seek stronger support.
If the rebound can hold and reclaim/stand above EMA7 (85993.11) and EMA25 (86122.39), then the bullish structure has a chance to continue. If it can’t hold these levels, or after rebounding it faces pressure again, then you need to be careful and look lower toward the Bollinger lower band (85625.47) or even further support levels. To say the current bearish logic is completely invalid, you’d need a breakout above the prior high area around 87722.27. Otherwise, the risk of a fade after a rise remains.
For market observation and scenario analysis only; it does not constitute a record of trading operations.
$BTC #熊市 #牛市 #交易
From the intraday structure, the price is still trading below EMA7 (85993.11) and EMA25 (86122.39). The Bollinger middle band (86266.81) is also pressing above. The OBV energy flow even shows signs of capital outflow. Although the MACD bearish momentum histogram bars are shrinking, the DIF and DEA are still in a bearish alignment. Overall, the short-term tape is indeed on the weak side.
But here’s the interesting part: the Stoch RSI data is classic. Both the K line and D line have dipped to the lower extreme of oversold by about 1.5, which, in principle, makes a short-term rebound more likely. Also, the long-to-short ratio is close to 2 (longs 66.2%), with long positioning still relatively high. The funding rate is also reasonably bullish. This suggests that quite a few participants inside the market are still optimistic about $BTC ’s outlook, which feels somewhat disconnected from the price action—definitely worth paying attention to.
So right now it’s a tug-of-war: the trend looks somewhat weak, while oversold conditions and bullish sentiment are brewing a potential bounce. It creates a contradictory situation. The key question is whether this wave of $BTC can hold ground, turning those bullish sentiments into a real rebound, or whether it keeps dipping to seek stronger support.
If the rebound can hold and reclaim/stand above EMA7 (85993.11) and EMA25 (86122.39), then the bullish structure has a chance to continue. If it can’t hold these levels, or after rebounding it faces pressure again, then you need to be careful and look lower toward the Bollinger lower band (85625.47) or even further support levels. To say the current bearish logic is completely invalid, you’d need a breakout above the prior high area around 87722.27. Otherwise, the risk of a fade after a rise remains.
For market observation and scenario analysis only; it does not constitute a record of trading operations.
$BTC #熊市 #牛市 #交易